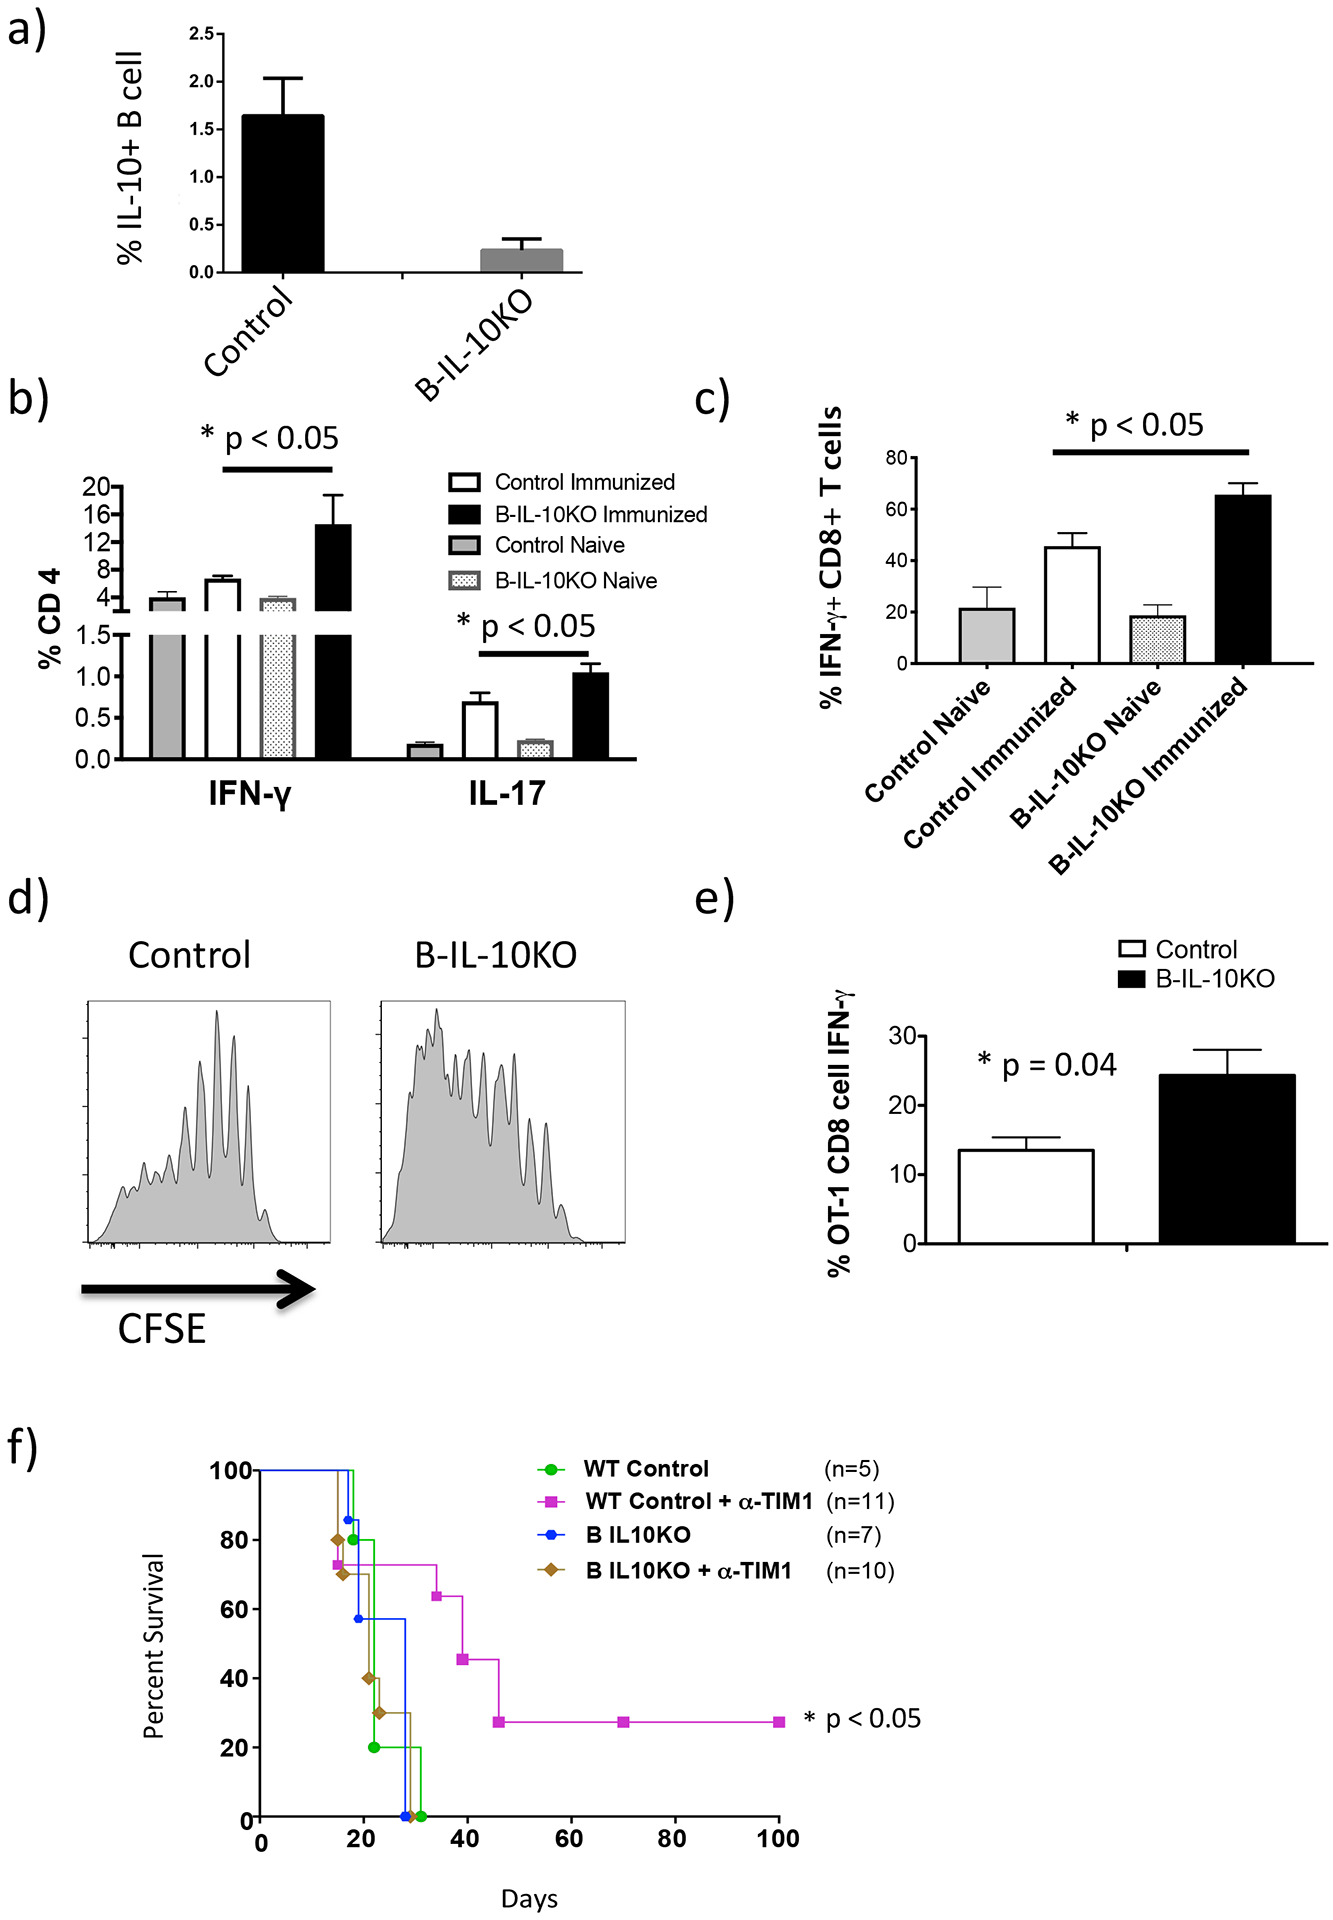
Figure 1. T cell produce increased levels of inflammatory cytokines and proliferate more in mice with B cells specific IL-10 deficiency.

hCD20-ERT2.Cre-IL-10fl/fl mice (B-IL-10KO) or Control (IL-10fl/fl) mice were treated with tamoxifen on days −3, −2 and −1 to specifically knockout the IL-10 gene in B cells. All mice were immunized with BALB/c splenocytes on day 0 and spleens harvested 14 days later to examine T cell cytokines. a) Bar graph showing IL-10 expression by B cells from B-IL-10KO vs. Control mice (n = 3). b) IFN-γ and IL-17 production by splenic CD4 T cells (n = 5). c) IFN-γ production by splenic CD8 T cells (n = 5). d) CFSE-stained OT-1 T cells were transferred into tamoxifen treated B-IL-10KO or Control mice, as described above, that were subsequently immunized with NP-OVA-alum i.p. and spleens were harvested on day 5. Histograms show OT-1 CFSE dilution for indicated treatment groups (n = 4). e) IFN-γ production by transferred OT-1 T cells on day 5 (n = 4). Graphs (a, b, c, e) show mean ± SD with Student’s t tests (unpaired, two tailed) to analyze data. f) Kaplan-Meir plots showing allograft survival of Cre+ Control (B6) or B-IL-10KO BALB/c islet recipient with and without anti-TIM-1 treatment. Log-rank test was carried out the analyze survival curve.
