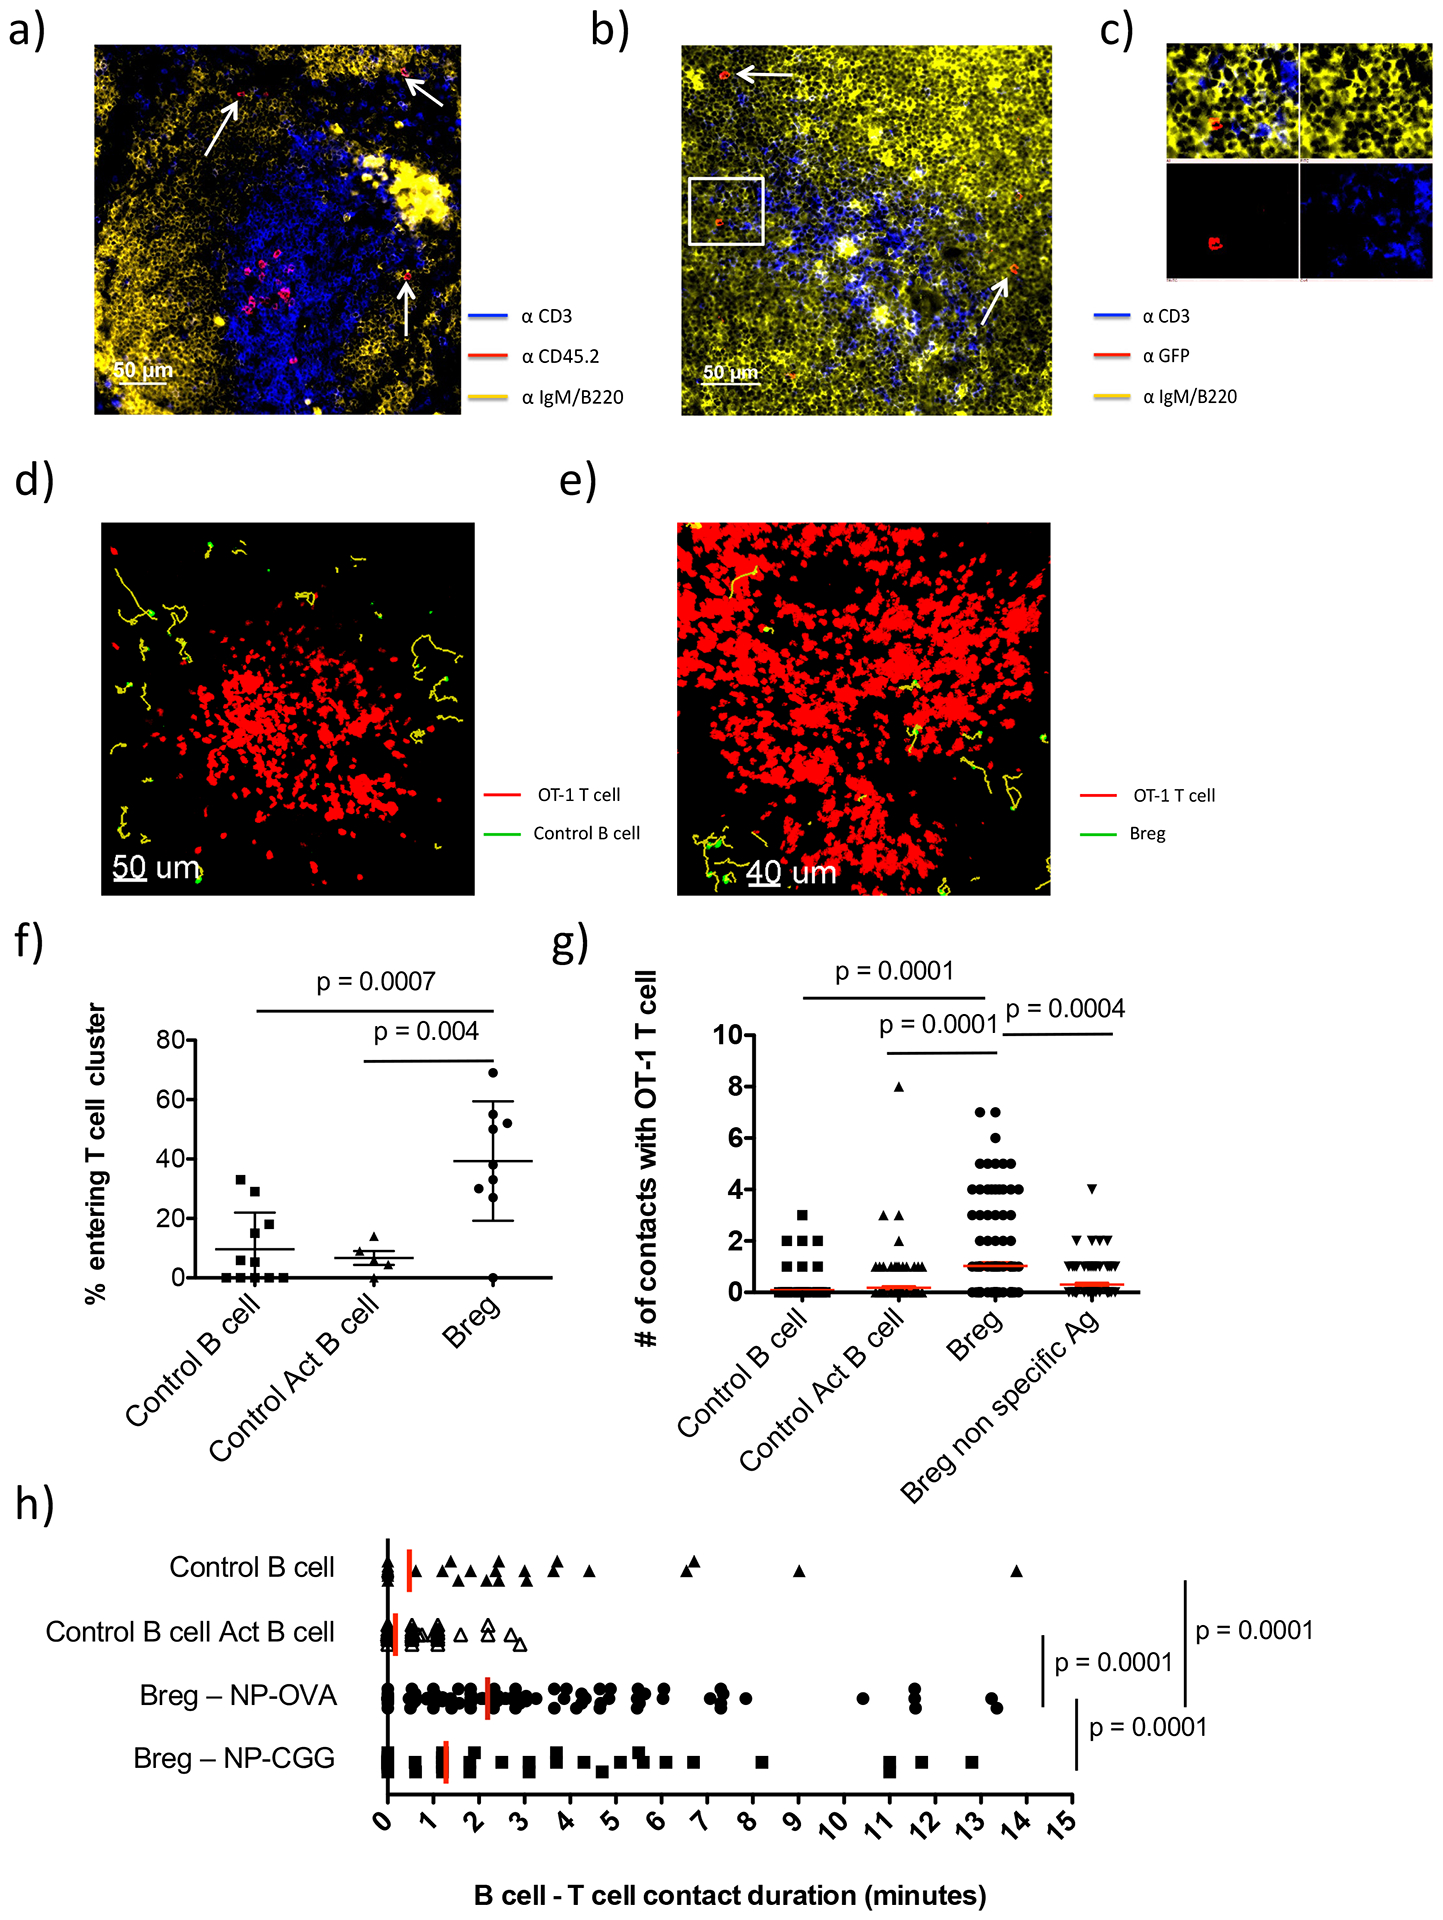
Figure 3. Localization and interactions of Bregs and Control B cells with OT-1 T cells in the spleen.

Experiments were carried out as described in Fig. S2a. (a-c): Immunofluorescence microscopic images of spleen sections of CD45.1 congenic mice 24h after transfer of CD45.2 Bregs and OT-1 cells. a) Section stained with anti-CD3 (T cells), anti-CD45.2 (transferred cells), and anti-IgM/B220 (B cells: same fluorochrome). b) Section stained with anti-CD3 (T cells), anti-IgM/B220 (B cells) and anti-GFP to specifically detect transferred Bregs. c) Inset from (b) zoomed in on a Breg cell showing separated fluorescent signals from each channel. d-e). 2-photon imaging snapshots showing transferred CFSE-stained Control B cells (GFP-, green) (d), or Bregs (GFP+, green) (e), around the periphery or within DS-red OT-1 T cell (red) clusters. f) Graph showing the frequency of Control B cell vs. Control activated B cell (Control Act B cell) vs. Breg cells entering T cell cluster. Each dot represents one individual 20–35 minute recording. Mean ± SD is shown. g) Graph showing the number of contacts between individual Control B cells, Control Act B cells, Bregs pulsed with NP-OVA or Bregs pulsed with NP-CGG with OT-1 T cells. Mean ± SEM is shown. h) Graph showing the duration (minutes) of each contact made by Control B cells, Control Act B cells, Bregs pulsed with NP-OVA or Bregs pulsed with NP-CGG with OT-1 T cells. Red line shows mean contact duration. Imaging results were obtained from 3–4 separate mice for each group with 131 Control B cells, 157 Control Act B cell, 135 Breg-NP-OVA and 90 Breg-NP-CGG cells tracked. Student’s t tests (unpaired, two tailed) was used to assess significant differences between groups.
