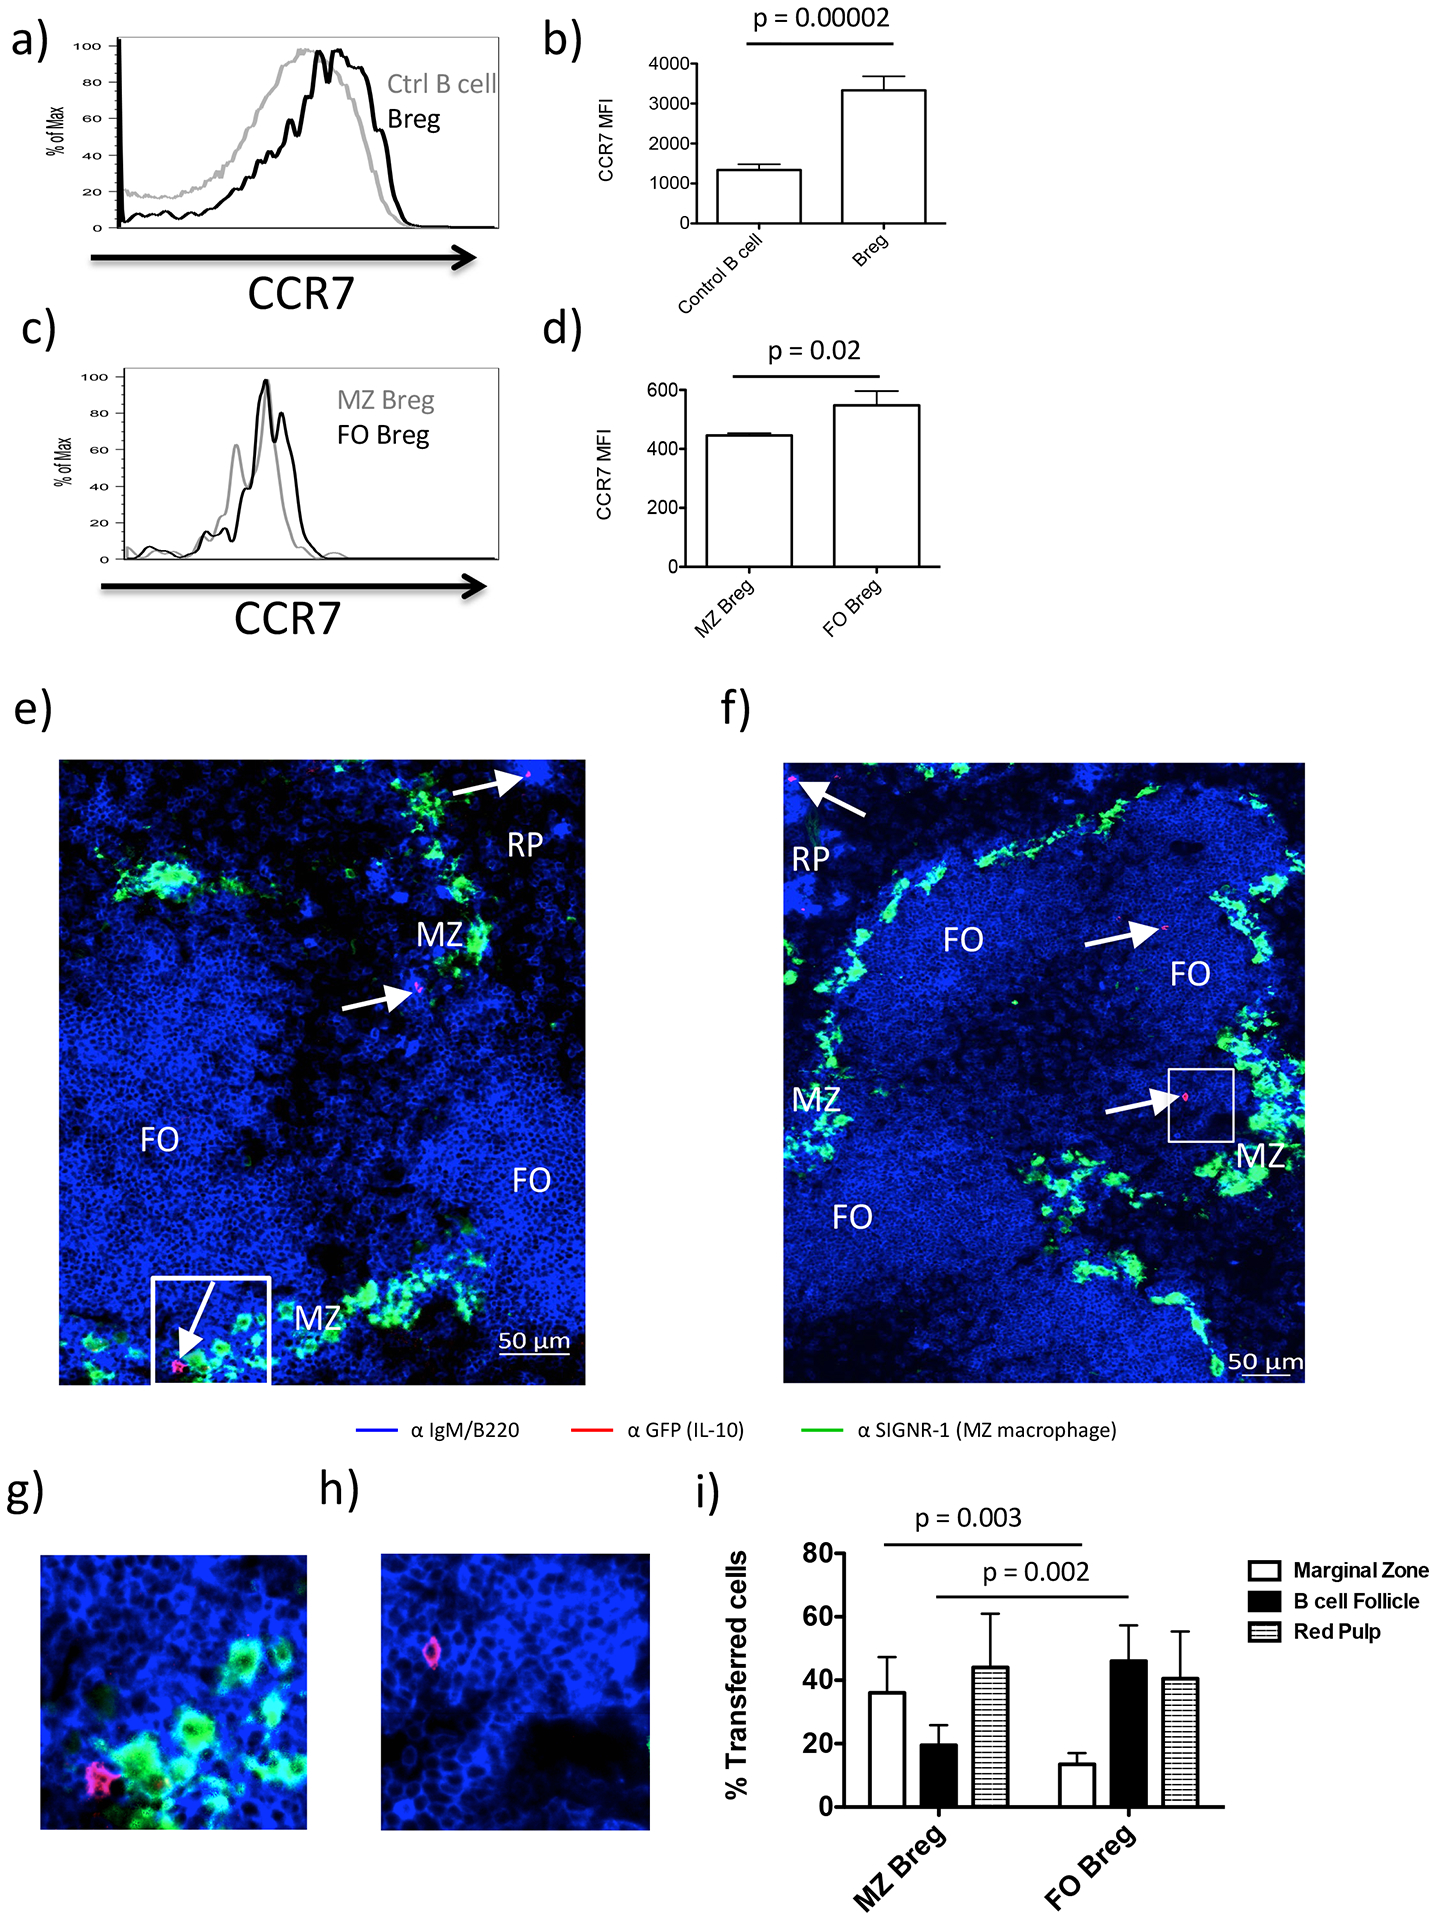
Figure 5. Breg chemokine expression and splenic localization.

Representative histogram overlays showing relative expression of: a) CCR7 expression on Bregs (black) vs. Control B cells (grey). b) Bar graph showing mean MFI ± SD for each cell type in (a). Data is representative of 4 mice. c) CCR7 expression on FO-Bregs (black) vs. MZ-Breg (grey). d) Bar graph showing mean MFI ± SD for each cell type in (c). e) MZ-Bregs were sorted from previously immunized Tiger mice based on established phenotypic markers (Fig. S1b) and transferred into B6 WT mice. To simultaneously detect endogenous FO B cells (B220hi IgMlo) and endogenous B cells localizing to the MZ and red pulp (B220lo IgMhi), we stained spleen sections with anti-B220 and anti-IgM conjugated to the same fluorophore (blue). The sections were also stained with anti SIGNR-1 (green), which labels MZ macrophages, demarcating the MZ as a narrow band that separates the follicles from the red pulp (RP) and anti-GFP (red) to detect the transferred cells. f) FO-Bregs were sorted from previously immunized Tiger mice based on established phenotypic markers (Fig. S1c) and transferred into B6 WT mice. Sections were stained as in described in (e). Arrows indicate staining for transferred cells. g) Inset from (e) showing zoomed in area of GFP+ cell located in MZ. h) Inset from (f) showing zoomed in area of GFP+ cell located in B cell follicle. i) Summary graph showing quantitation of transferred MZ and FO Breg migration to indicated splenic niche. Mean ± SD is shown for each graph. n = 3–5 mice per group. Student’s t tests (unpaired, two tailed) was used to assess significant differences between groups.
