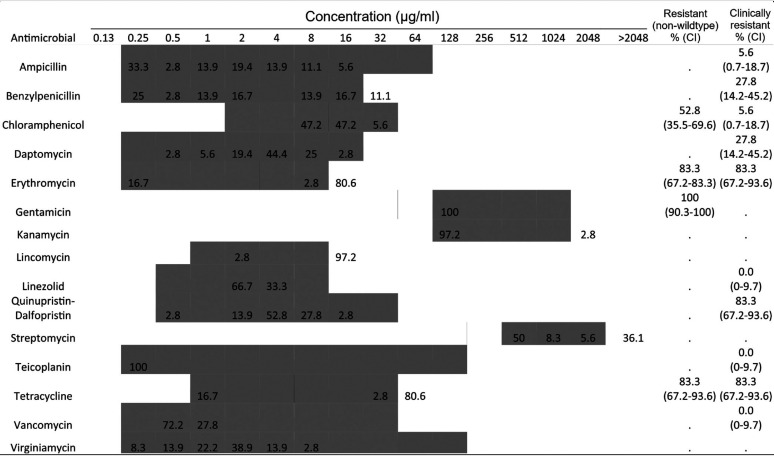
TABLE 2.
MICs of E. hirae isolates (n = 36)a
The shaded areas indicate the dilution ranges tested. Vertical bars indicate the resistance breakpoints. Values for MIC distributions and frequencies of resistance are represented as percentages of isolates. Confidence intervals for non-wild-type and clinically resistant isolates are indicated in parentheses.

