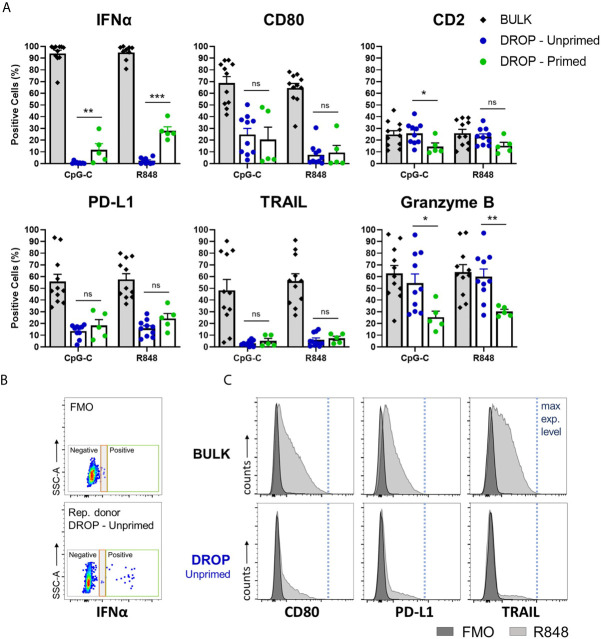
Figure 2.
Single-cell analysis reveals functional and phenotypical heterogeneity within single-activated pDCs. Freshly isolated pDCs were either primed or left unprimed, coated with IFNα Catch Reagent, and activated in bulk or droplets as described before. The pDCs were activated with 5 or 50 μg/mL CpG-C or R848, for bulk and droplet conditions respectively, for 18h. Next, pDCs were stained for viability, IFNα secretion, marker expression of CD80, PD-L1, TRAIL, CD2, granzyme B, and analyzed by flow cytometry. (A) Data represent mean percentages of IFNα-secreting and marker-expressing pDCs plotted against treatment condition; error bars indicate SEM; BULK n = 11; DROP-Unprimed n = 10; DROP-Primed n = 5 for both CpG-C and R848. (B) Dot plots depicting IFNα expression levels of FMO control and representative donor, DROP-Unprimed. Depicted in the colored boxes are negative events (gray) technological noise (red), and positive events (green). (C) pDCs were treated as described above. The histograms are representatives of expression levels of viable pDCs stimulated with R848 in either bulk or droplets from one donor, compared to FMO controls. Indicated with the blue dotted line are the maximum expression levels. Mann–Whitney test *p < 0.05, **p < 0.01, ***p < 0.001. ns, non-significant.

