Figure 4.
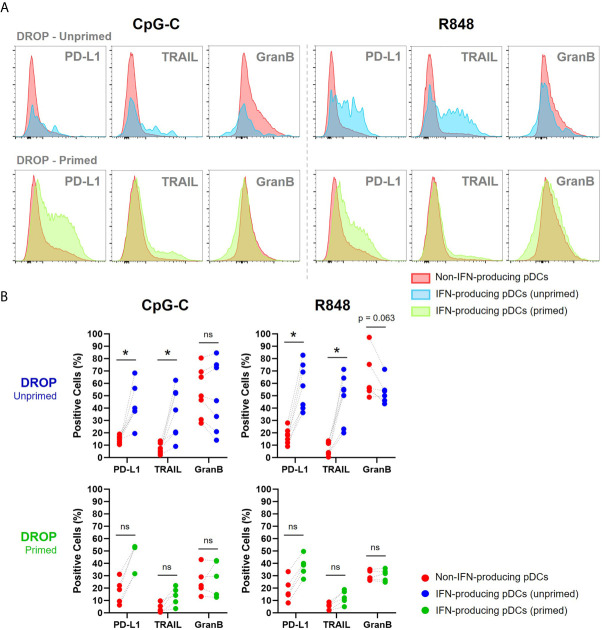
IFNα producing pDCs are phenotypically similar to previously described killer pDCs. (A) Single-encapsulated pDCs were either primed or left unprimed, incubated with IFNα Catch Reagent, activated with 50 μg/mL CpG-C or R848 for 18h and gated for IFN-producing (blue; unprimed, and green; primed) and non-IFN-producing pDCs (red). Histograms represent relative expression levels of PD-L1, TRAIL and granzyme B for merged data of 7 and 5 representative donors for unprimed and primed conditions, respectively. (B) Scatter plots show paired data of non-IFN-producing pDCs, IFN-producing pDCs and their corresponding percentage of positive cells for PD-L1, TRAIL and granzyme B per donor. Wilcoxon signed-rank test. *p < 0.05. ns, non-significant.

