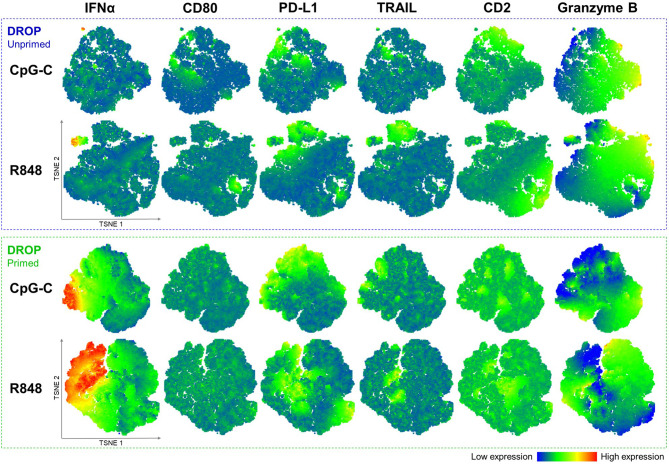
Figure 5.
Multi-dimensional data analysis shows clustering of early IFNα-producing pDCs with co-expression of PD-L1 and TRAIL. Single pDCs were either primed or left unprimed, incubated with IFNα Catch Reagent, activated with 50 μg/mL CpG-C or R848 for 18 hours, retrieved, stained for viability and markers of interest, and analyzed with flow cytometry as described earlier. Depicted are t-SNE plots based on the reanalysis of earlier presented data, based expression of IFNα, CD80, PD-L1, TRAIL, CD2, and granzyme B; DROP-Unprimed n = 10; DROP-Primed n = 5. Individual events are colored according to the expression of each indicated marker. Corresponding heatmap indicates the level of expression from low (blue) to high (red). Iterations 1000, perplexity 30.

