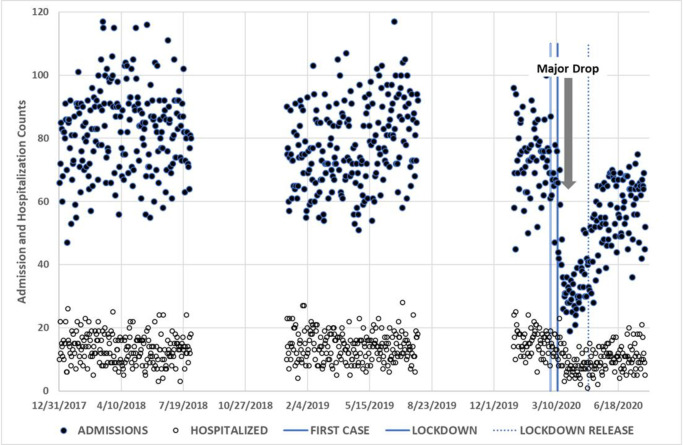
Fig 3. Plot of daily admission and hospitalization counts during 2018 to 2020.
Vertical lines mark critical time points during the pandemic crisis: 1 March 2020, for first case discovered; 12 March 2020 for first lockdown; 1 May 2020 for lockdown release; Bold arrow shows a drop in PED admissions due to the pandemic.

