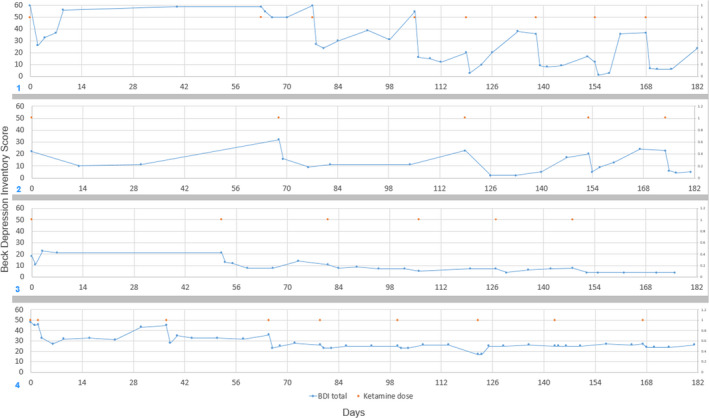
FIGURE 1.

Beck depression inventory‐I vs days from initial dose. Cases 1‐4, respectively. Orange dots = ketamine administration day. Blue dots BDI measurement (y‐axis) and day (x‐axis). Days with both Blue and Orange dots depict the preadministration BDI
