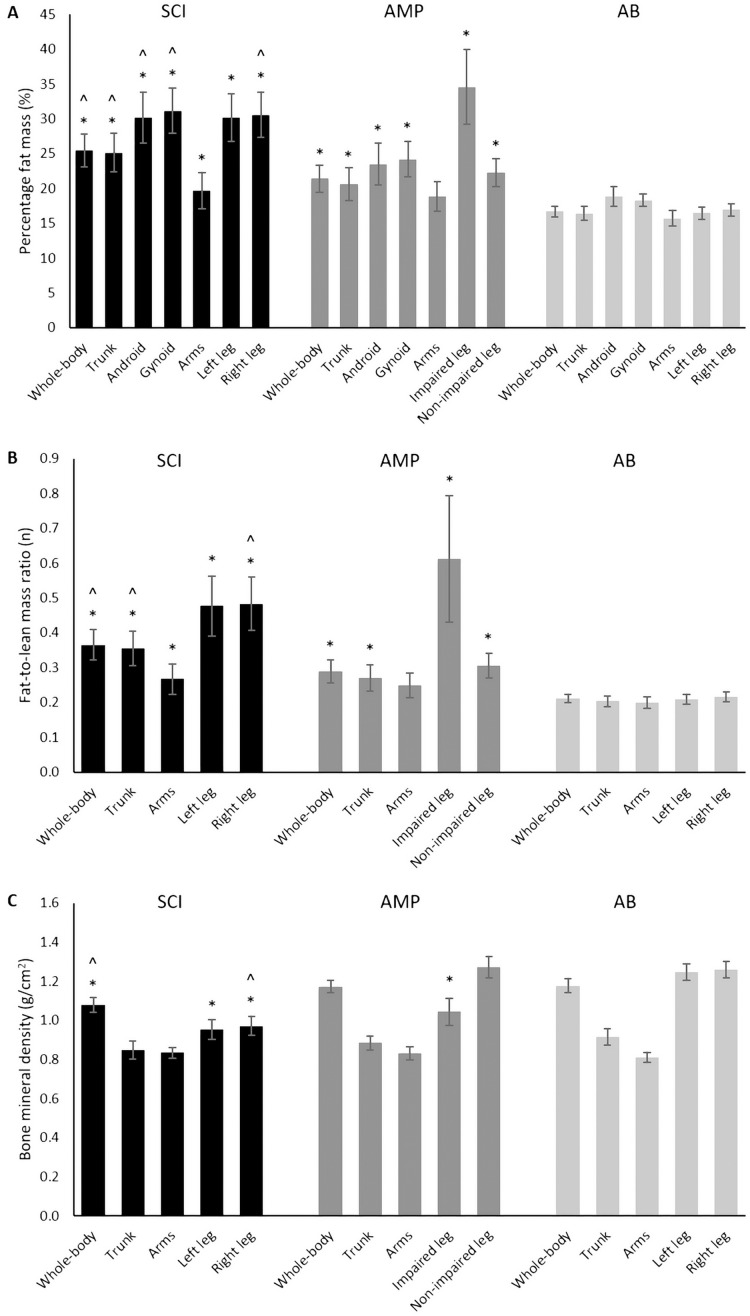
Figure 1. Percentage fat mass (A), fat-to-lean mass ratio (B) and bone mineral density (C) assessed in the SCI, AMP and AB groups.
SCI, athletes with spinal cord injury; AMP, athletes with unilateral lower limb amputation; AB, able-bodied athletes. Data are mean with Confidence Intervals. *, significantly different from the AB group; ^, significantly different from the AMP group.

