
Fig. 6.
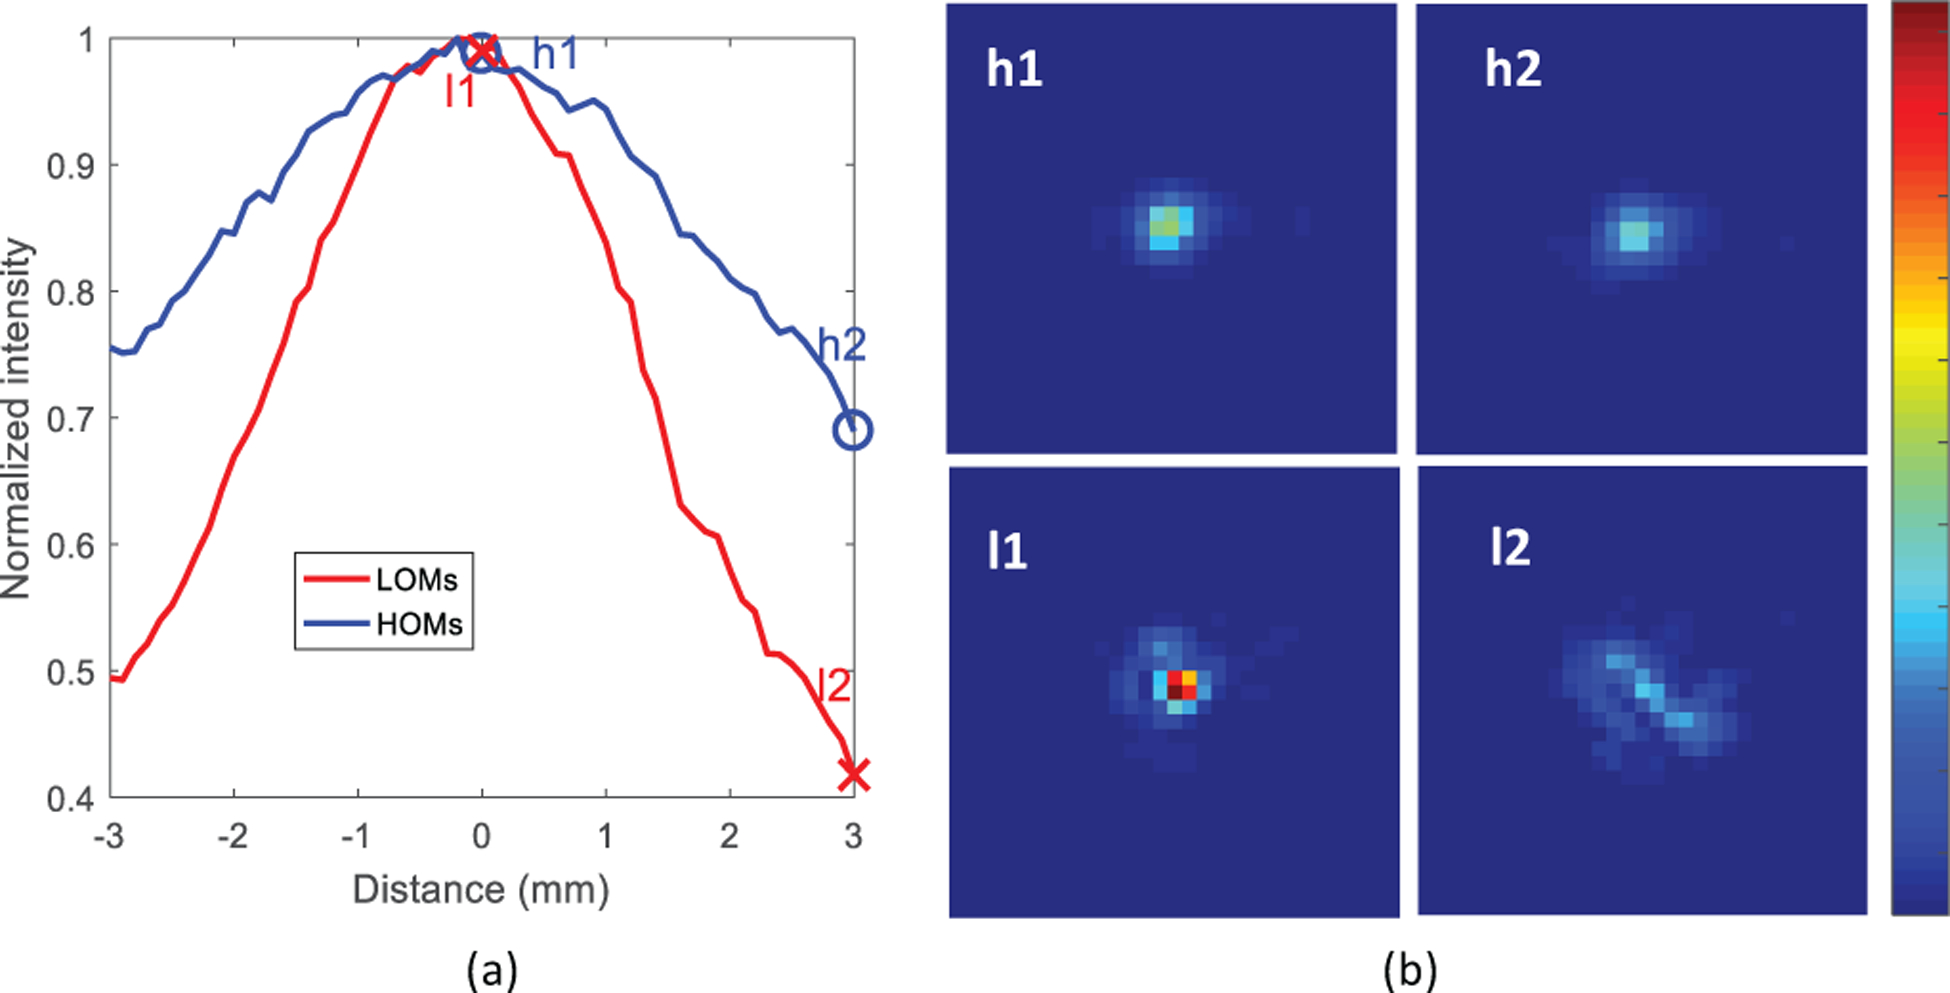
Experimental demonstration of bending resilience of focal spots created using different mode sets. (a) Plot of normalized peak focal intensity of 200 near-axis focal spots created using LOMs(red) and 200 near-boundary focal spots created using HOMs (blue) with translation of the fiber distal tip. (b) Evolution of example focal spots l1 and h1 created using LOMs and HOMs respectively at the initial fiber position into l2 and h2 after a 3mm translation of the distal tip. The positions of the spots are marked in (a).