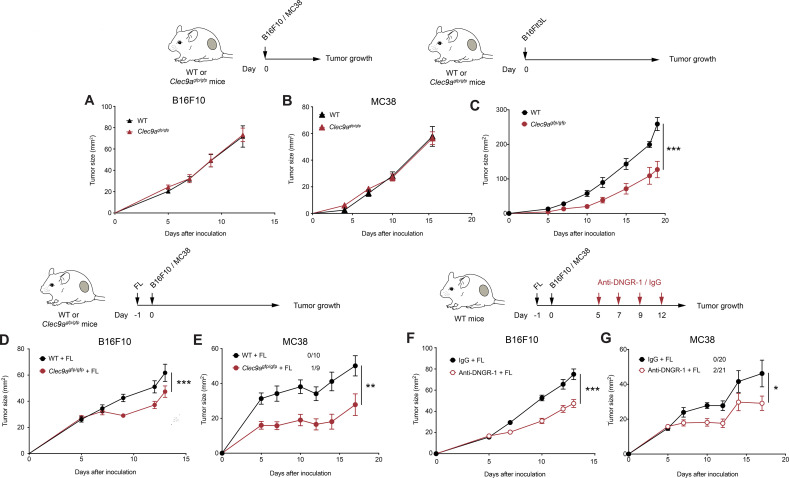
Figure 1.
DNGR-1 absence delays tumor growth on Flt3L overexpression. (A, B) B16F10 and MC38 tumors were inoculated subcutaneously in the right flank of WT or Clec9agfp/gfp mice. Growth curves of B16F10 (A) and MC38 (B) tumors. (C) Flt3L-overexpressing B16F10 tumors were inoculated subcutaneously in the right flank of WT (black) or Clec9agfp/gfp (red) mice. The graphs show tumor growth kinetics. (D, E) WT and Clec9agfp/gfp mice were hydrodynamically injected intravenously with a plasmid encoding a secreted form of Flt3L (FL) and 1 day later they were inoculated subcutaneously with B16F10 (D) or MC38 tumors (E). Tumor growth is depicted. (F, G) Tumor growth of B16F10 (F) and MC38 (G) tumors inoculated subcutaneously into WT mice pretreated with FL hydrodynamic injection and receiving intraperitoneal DNGR-1-blocking antibodies (red) or an isotype control (black) at days 5, 7, 9 and 12 of tumor development. (A) Pool of two independent experiments, with n=10 per group. (B) Pool of three independent experiments (n=19 for WT mice and n=20 for Clec9agfp/gfp mice). (C) Pool of two independent experiments, with n=10 per group. (D) Pool of three independent experiments with n=24 for WT mice and n=26 for Clec9agfp/gfp mice. (E) Pool of two experiments with n=10 for WT mice and n=9 for Clec9agfp/gfp mice. (E, G) Numbers following experimental groups indicate number of complete rejections/total number of mice in the experiment. (F) Pool of three experiments with n=22 for mice receiving isotype control and n=24 for mice treated with anti-DNGR-1. (G) Pool of three experiments with n=20 for mice receiving isotype control and n=21 for mice receiving anti-DNGR-1-blocking antibodies. (A–G) Statistical significance was assessed by two-way analysis of variance. All data are shown as mean±SEM. *p<0.05, **p<0.01 and ***p<0.001. WT, wild type.

