Figure 2.
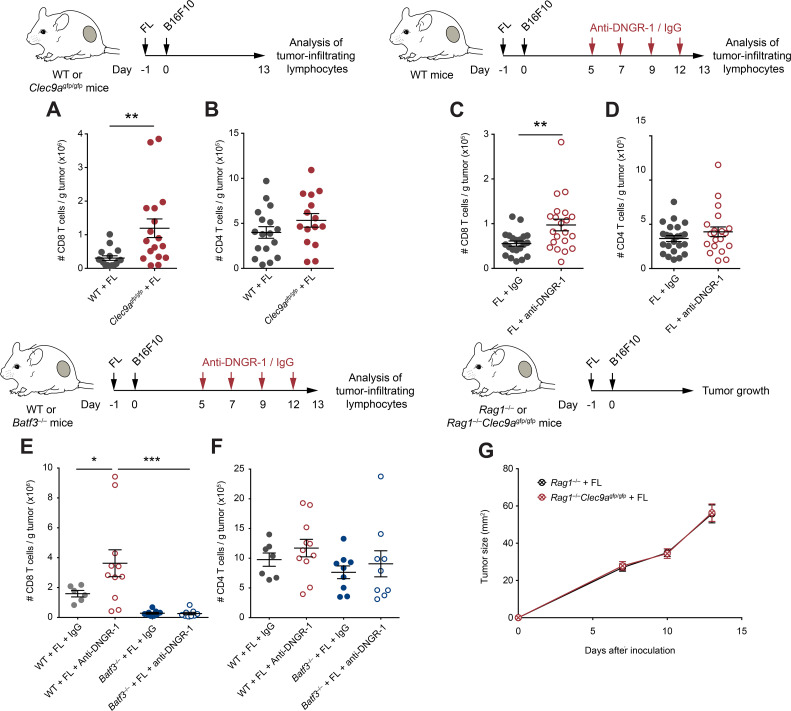
Enhanced CD8+ T cell antitumor immunity in Flt3L (FL)-overexpressing DNGR-1-deficient mice. (A, B) WT and Clec9agfp/gfp mice were inoculated with B16F10 tumors subcutaneously in the right flank 1 day after pretreatment with FL. At day 13 after tumor inoculation, tumors were harvested and cell suspensions were analyzed by flow cytometry. Numbers of CD8+ (A) and CD4+ (B) T cells per gram of B16F10 tumor were quantified. (C–F) WT (C–F) and Batf3–/– (E, F) mice were hydrodynamically inoculated intravenously with FL. One day later, B16F10 tumors were injected subcutaneously in the right flank. Mice received intraperitoneal anti-DNGR-1-blocking antibodies or an isotype control at days 5, 7, 9 and 12. At day 13 of tumor development, tumors were collected for flow cytometry analysis of tumor-infiltrating lymphocytes. Numbers of CD8+ (A, C, E) or CD4+ (B, D, F) T cells per gram of B16F10 tumor are shown. (G) Rag1–/– and Rag1–/–Clec9agfp/gfp mice were pretreated with FL and, 1 day later, B16F10 tumors were inoculated subcutaneously in the right flank. Graph shows tumor growth curves. (A, B) Pool of three experiments with n=17 mice per group. (C, D) Pool of four experiments with n=23 for WT mice treated with isotype control and n=21 for anti-DNGR-1-treated mice. (E, F) Pool of two independent experiment, with n=7 for WT mice receiving isotype control, n=11 for WT mice treated with anti-DNGR-1 antibodies, n=9 for Batf3–/– mice receiving isotype control and n=9 for Batf3–/– mice receiving anti-DNGR-1 antibodies. (G) Pool of three independent experiments with n=19 for Rag1–/– mice and n=14 for Rag1–/–Clec9agfp/gfp mice. (A–F) Each point represents a single mouse. All data are shown as mean±SEM. Statistical significance was evaluated with Student’s t-test (A–D) and one-way analysis of variance (ANOVA) followed by Fisher’s least significant difference test (E, F). (G) Statistical significance was evaluated with two-way ANOVA. *p<0.05, **p<0.01 and ***p<0.001. WT, wild type.

