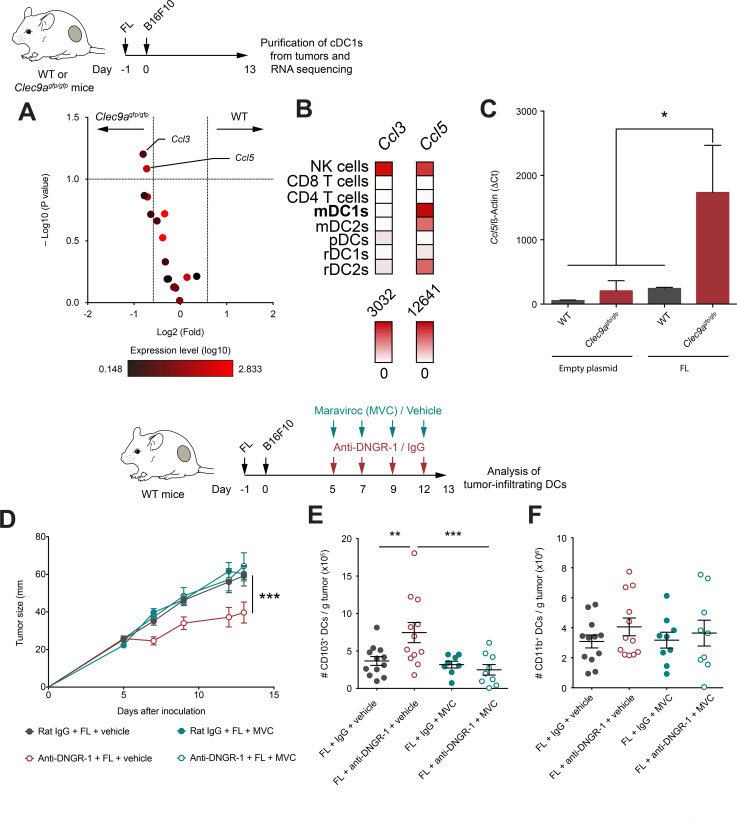
Figure 5.
DNGR-1 regulates CCL5/CCR5-mediated infiltration of conventional type 1 dendritic cell (cDC1) in the tumor on Flt3L administration. (A) Volcano plot of chemokines detected in the RNA-seq experiment shown in figure 5. Red color intensity indicates expression level (log10), x-axis indicates fold change of expression in intratumor CD103+ dendritic cells (DCs) from WT compared with Clec9agfp/gfp mice and y-axis indicates negative log10 (FDR, p value). (B) Expression profile of Ccl3 and Ccl5 across different immune populations from GSE15907. (C) Ccl5 expression relative to β-actin by qPCR from CD103+ DCs purified from 13-day B16F10 tumors grown in WT and Clec9agfp/gfp mice hydrodynamically injected intravenously with FL or an empty plasmid. (D–F) WT mice were pretreated with FL, and after 24 hours, they were inoculated subcutaneously with B16F10 tumors in the right flank. Over the course of tumor growth, mice were treated intraperitoneally at days 5, 7, 9 and 12 with anti-DNGR-1-blocking antibodies or an isotype control. Together with antibody administration, mice received maraviroc (MVC) or vehicle intraperitoneally. Tumor growth kinetics is shown (D). At day 13 after tumor inoculation, tumors were collected for quantification of tumor-infiltrating DCs by flow cytometry. Numbers of CD103+ (E) or CD11b+ (F) DCs per gram of tumor are shown. (C) Pool of three experiments with n=2–3 mice pooled per experiment. Pool of two independent experiments with n=12 for vehicle groups and n=9 MVC groups. (C–F) All data are shown as mean±SEM. (E, F) Each dot represents a single mouse. (D) Statistical significance was evaluated with two-way analysis of variance (ANOVA). (E, F) Statistical significance was evaluated with one-way ANOVA followed by Fisher’s least significant difference test. *p<0.05, **p<0.01 and ***p<0.001.

