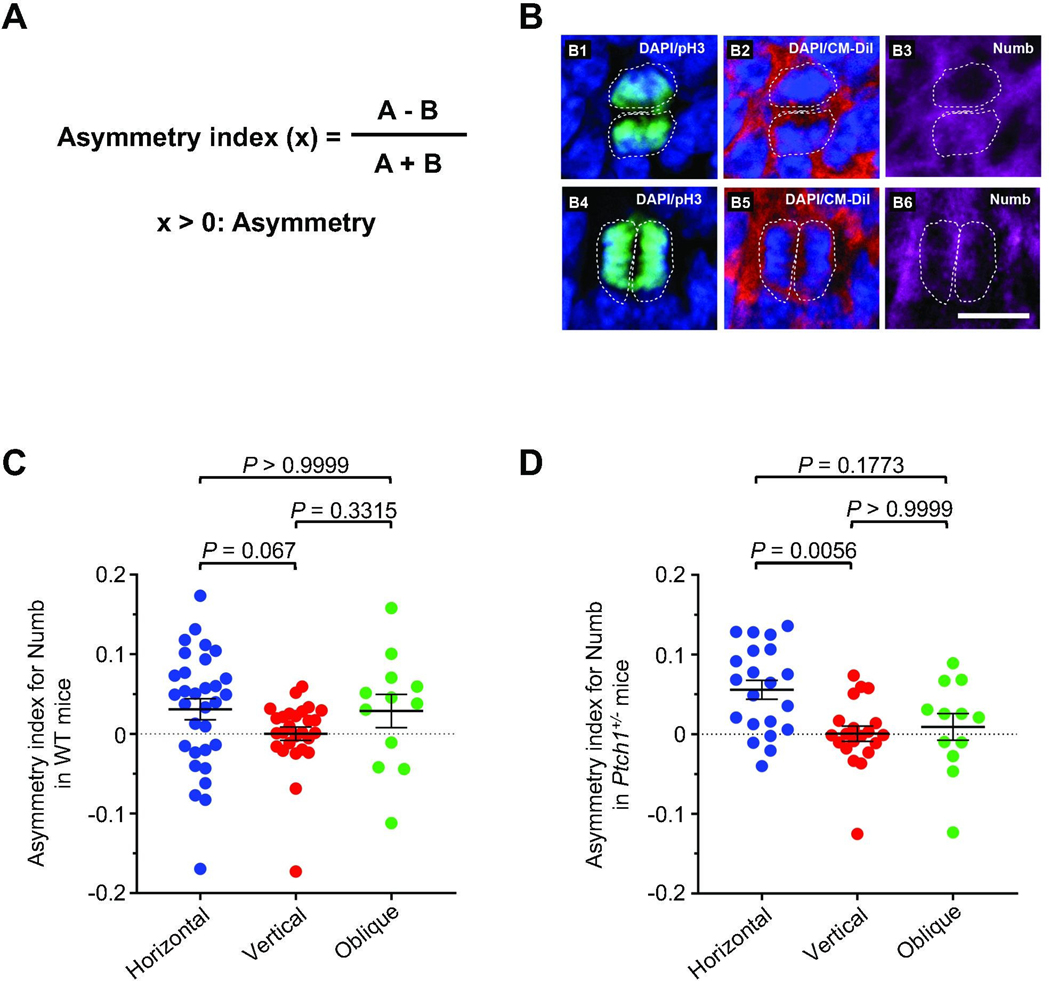
Fig. 3. Spindle orientation of dividing GCPs correlates with the distribution of symmetry markers.
(A) Formula for generating the asymmetry index. A and B, respectively refer to quantified level of immunofluorescent signal of Numb immunochemistry signal from the daughter cell further from, or closer to the pia. (B) Representative immunofluorescent staining for Numb (pink) and phospho-histone H3 (green). CM-DiI (red) and DAPI (blue) were used to demarcate nuclei and outer membrane of individual GCPs in sagittal cerebellar sections from wild type mice at P3 in GCPs dividing horizontally (B1-B3) or vertically (B4-B6) to the pial surface. White dashed lines represent the cell boundaries visualized using CM-Dil. (C, D) Quantitative analyses for the distribution of Numb in GCPs from WT mice (C) and Ptch1+/− mice (D) with vertical (0–30°), horizontal (60–90°), or oblique (30–60°) cell divisions with respect to the pial surface. P=0.0563 for WT mice, P=0.0065 for Ptch1+/− mice, determined using a Kruskal-Wallis test with Dunn`s post hoc test for multiple comparisons. Scale bars, 10 μm.

