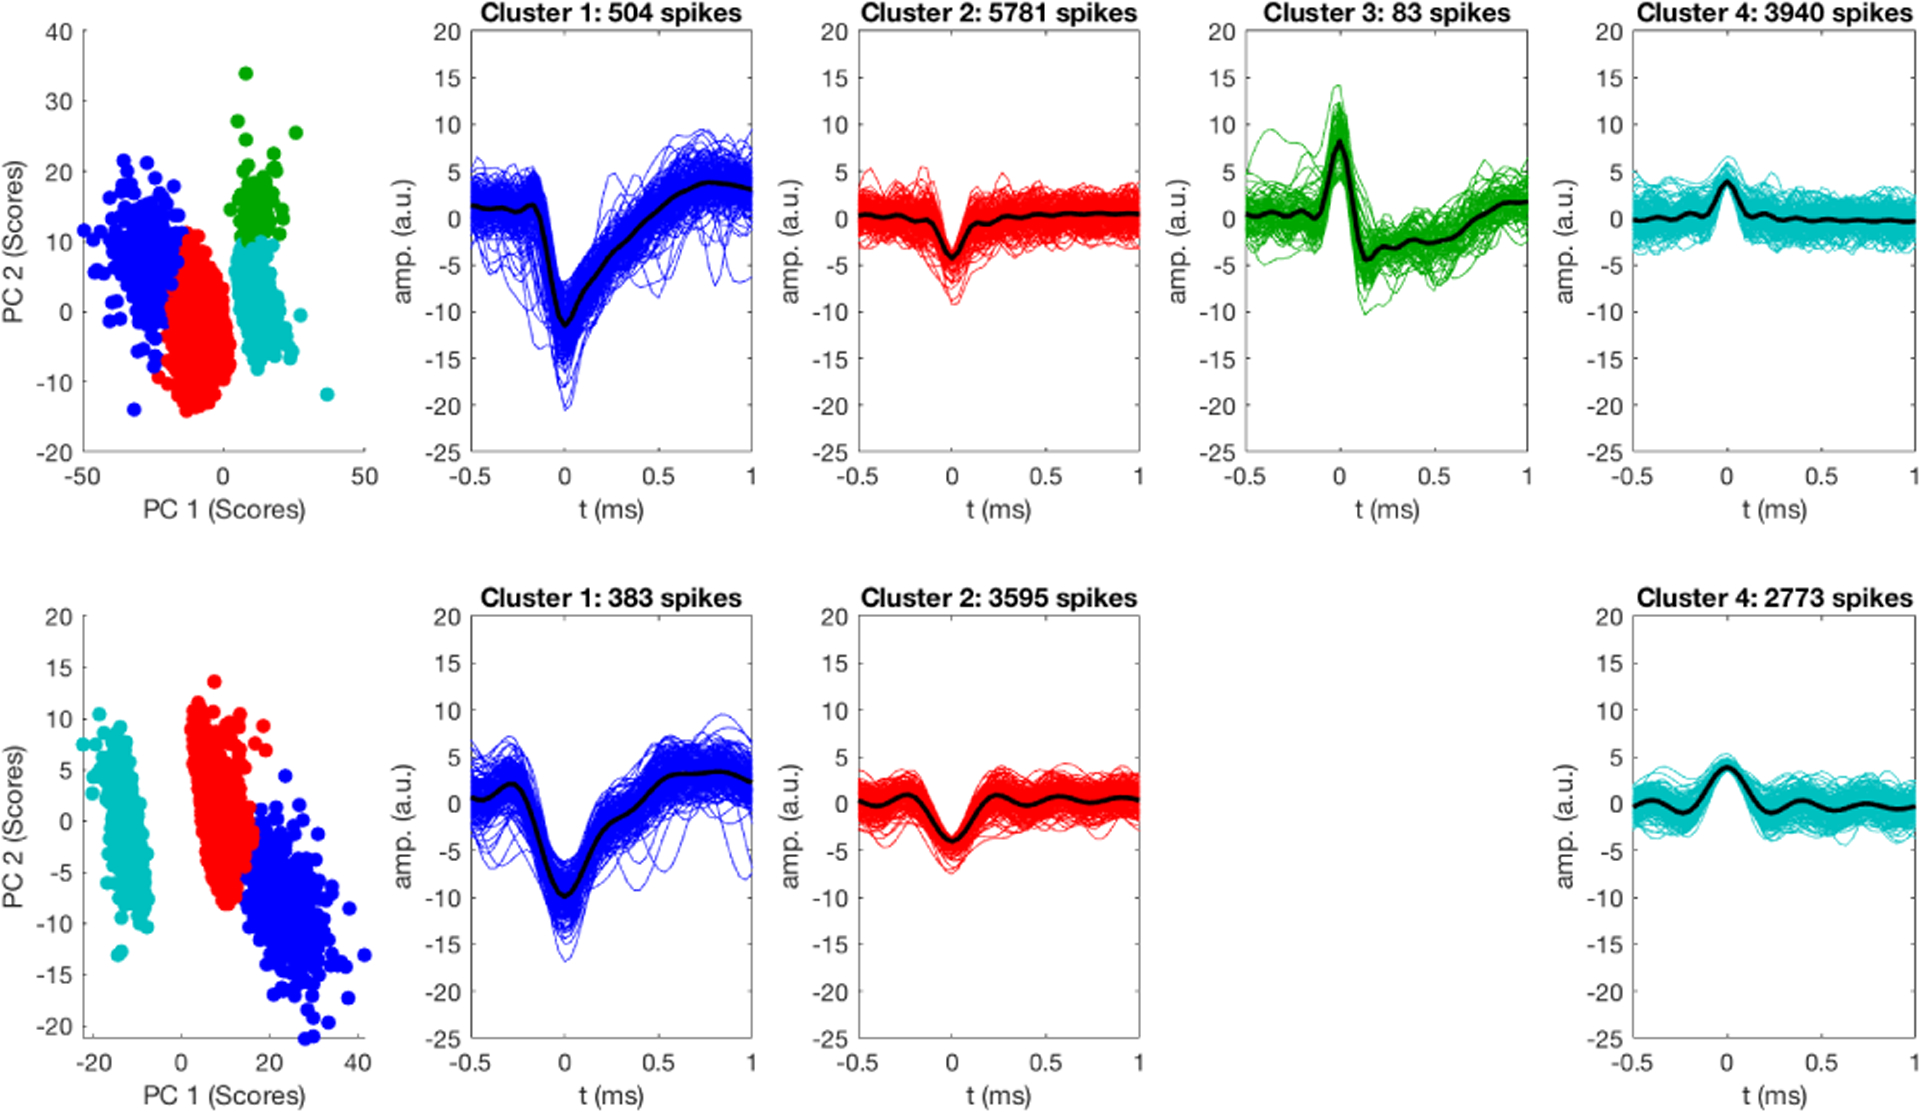
Figure 14.

Amplifier in low gain mode - clustering MUA recorded on the benchtop (top row) compared to in the bore of the 16.4T MRI scanner after adaptive noise removal (bottom row). In low gain mode we observed increased noise in the 3–6 kHz range inside the scanner, so we used a narrower bandpass filter (300–3000 Hz instead of 300–6000 Hz). The performance and clustering in low gain mode in the MRI scanner bore is not as good as on the benchtop, but we can still identify MUA activity. Classification was based on eight minutes of data.
