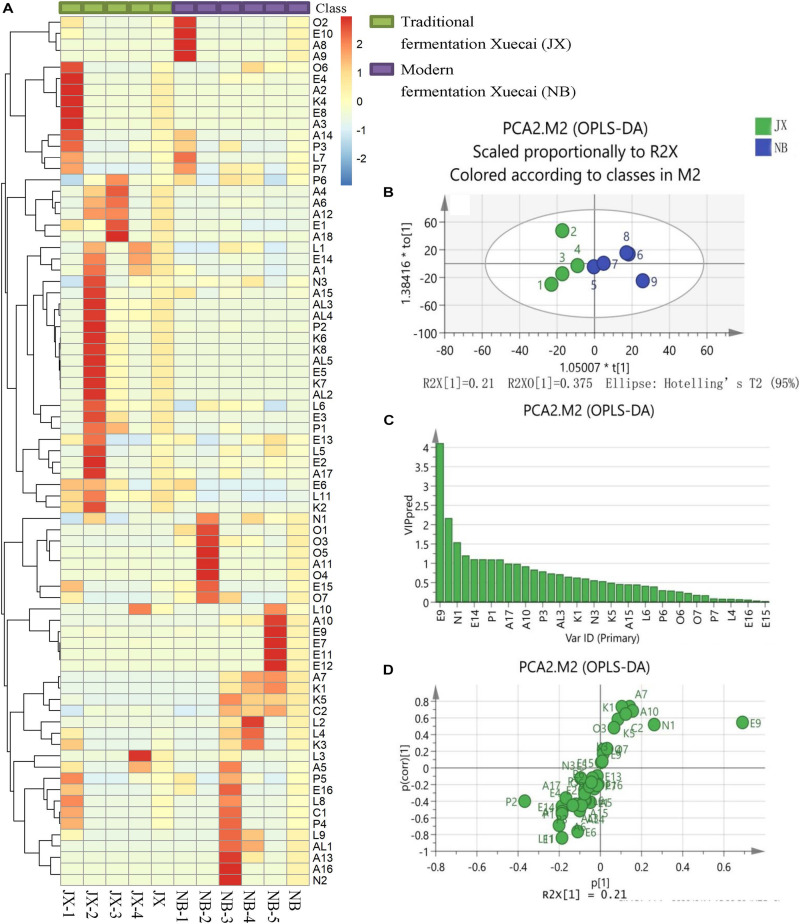
FIGURE 1.
Heatmap visualization (A), OPLS-DA score plot (B), VIP plot (C), and loading S-plots (D) of the flavor compounds in traditional fermentation Xuecai and modern fermentation Xuecai based on GCMS data. For interpretation of the code in this figure, the reader is referred to the Table 2 and Supplementary Table 2.

