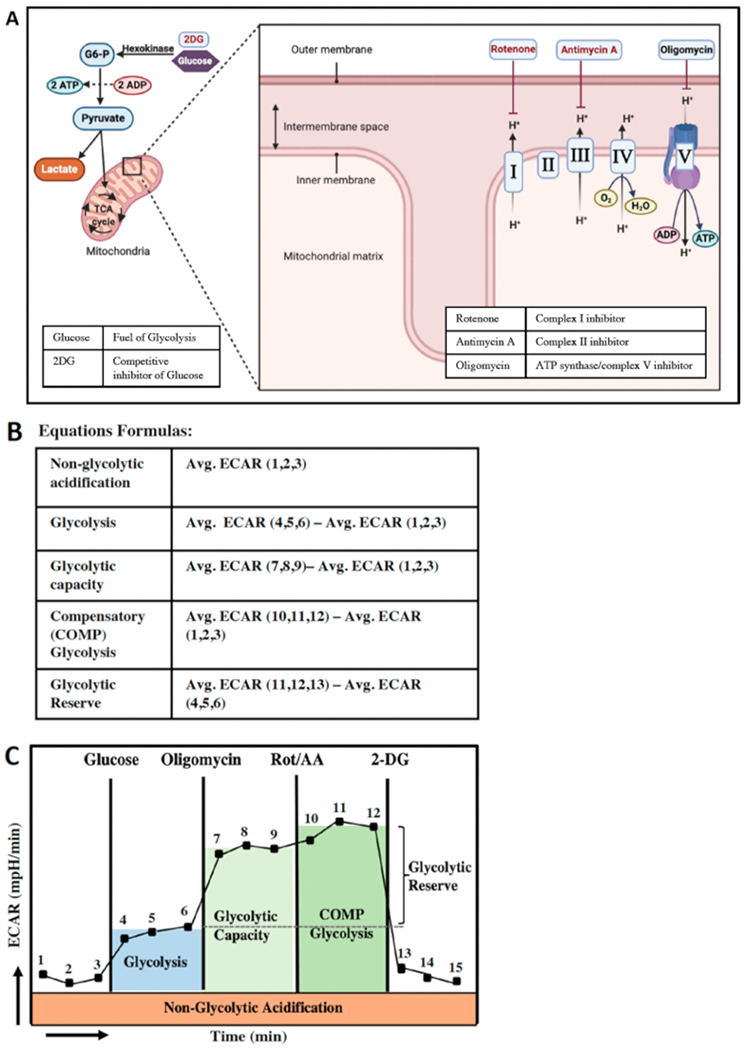
Figure 4: Energy production in the cell and glycolytic parameters.

(A) schematic view of the two most important energy production pathways in the cell; Glycolysis (left) and mitochondrial oxidative phosphorylation (right). Glycolysis is the conversion of glucose to pyruvate. XF analyzer can detect the protons that are produced by conversion of pyruvate to lactate as ECAR (mpH/min) levels. Inhibition of the ATP synthase followed by inhibition of complex I and II the in mitochondrial electron transport chain will eliminate the ATP production and proton efflux through OCR. (B) calculation of glycolytic parameters. (C) Glycolytic function parameters after each compound injection.
