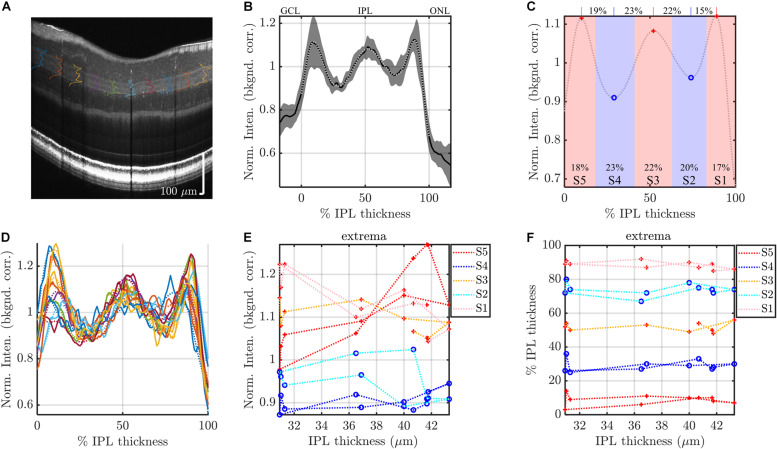
FIGURE 3.
Segmental analysis: example analysis of IPL segments to evaluate topography. (A) IPL intensity profiles (background corrected, averaged transversally over 1.5° segments, and normalized) are displayed across the image. As in Figure 2, the average IPL profile (B), with polynomial fit and derived stratification parameters (C), are shown. (D) To evaluate topography, individual 1.5° segments are analyzed. Each segmental polynomial fit (dotted lines in D) provides extrema (E) and their locations (F), using the image-averaged profile (C) as a template (see main text). Red crosses are segmental maxima and blue circles are segmental minima. This segmental analysis reveals variations in stratification with either IPL thickness (abscissa in E,F) or eccentricity. Data from consecutive segments are connected with dotted lines.

