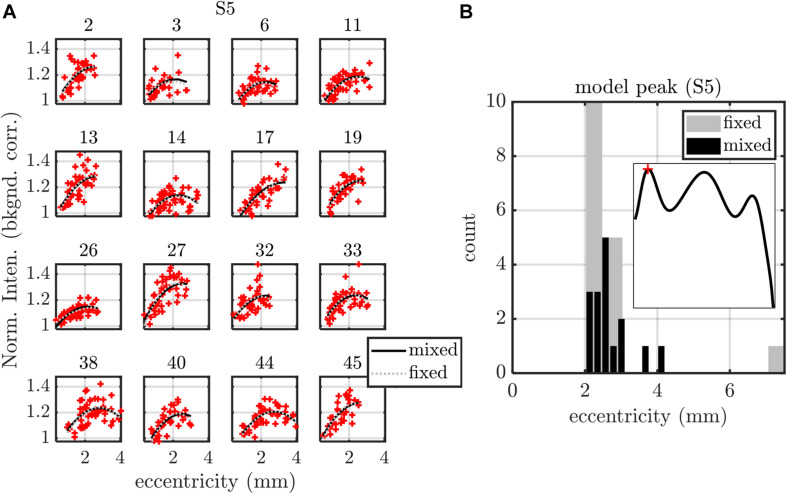
FIGURE 8.
Summary of fixed (fixed intercept, slope, and quadratic term for each subject) and mixed (fixed intercept, slope, and quadratic term as well as random intercept, slope, and quadratic term for each subject) effects models, applied to S5 peak versus eccentricity. (A) Model fits are shown for each of the 16 subjects, with subject index in subplot titles. (B) Both fixed and mixed effects models predict a maximum of the parabolic S5 peak profile around 2.4 mm eccentricity. Models for all other stratification parameters are summarized in Table 1 (eccentricity as a predictor) and Table 2 (IPL thickness as a predictor).

