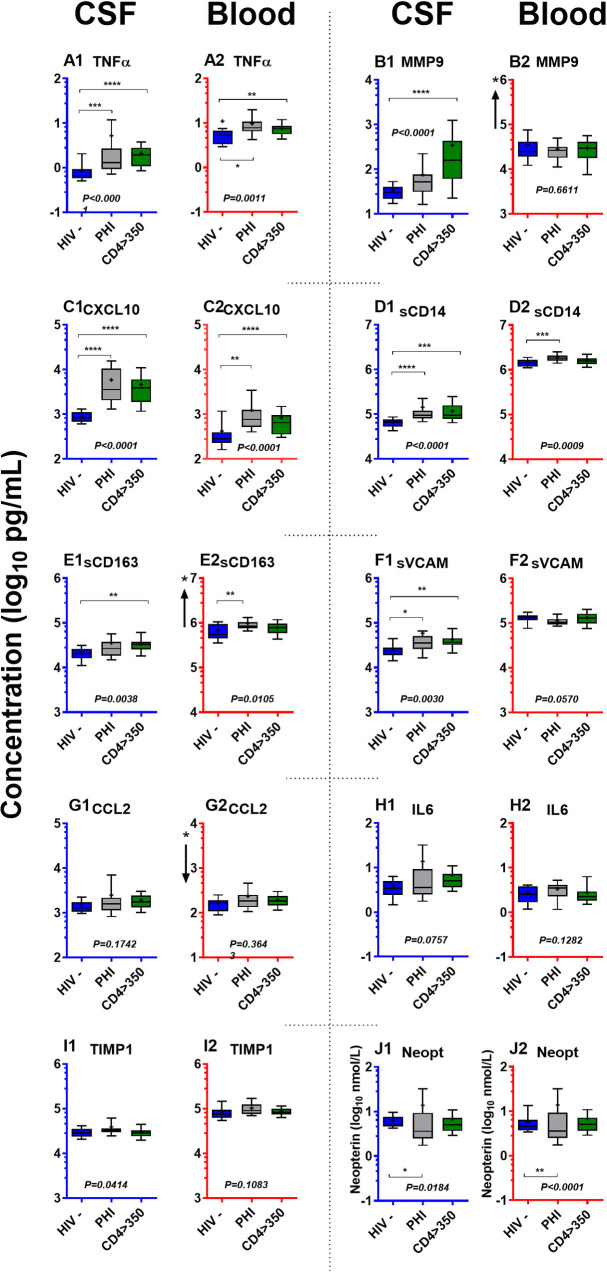
Fig 3. CSF and blood inflammatory biomarkers in PHI compared to HIV-uninfected and early chronic infection.
These graphs use the same format, axes and unit scales as Fig 1A. but isolate three subject groups: HIV negatives, PHI and the NA group with >350 CD4+ blood T cells in order to examine the ‘transition’ during PHI from seronegative to early chronic infection. P values in italics give the overall Kruskal-Wallis ANOVA significance, while the horizontal bars show P values of individual post hoc testing using Dunn’s multiple comparison test for the three-group comparison: * P <0.05; ** P <0.01; *** P <0.001; and **** P <0.0001. This analysis is also outlined in Table 3. Since this figure is extracted from Fig 1A, the subject numbers are listed in the legend of that figure.

