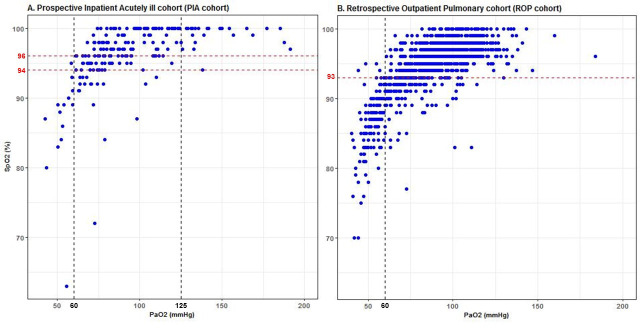
Fig 2. Scatterplots of the data pairs of the Prospective Inpatient Acutely ill cohorts and Retrospective Outpatient Pulmonary cohort.
A. Prospective Inpatient Acutely ill cohort (PIA cohort) and B. Retrospective Outpatient Pulmonary cohort (ROP cohort). The black dashed vertical lines reflect the PaO2 values of 60 mmHg and 125 mmHg. The red dashed vertical lines reflect the calculated lower and upper bounds to avoid hypoxemic and hyperoxemic PaO2 measurements.

