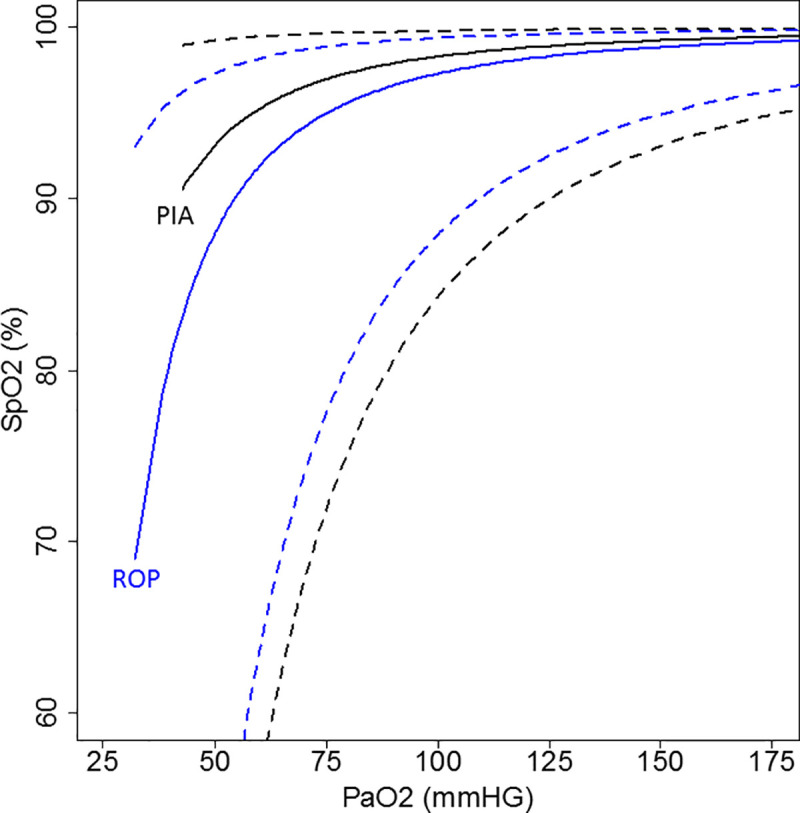
Fig 3. Multilevel analysis of the Prospective Inpatient Acutely ill and Retrospective Outpatient Pulmonary cohort.

PIA, Prospective Inpatient Acutely ill cohort. ROP, Retrospective Outpatient Pulmonary cohort. The black curve represents the Prospective Inpatient Acutely Ill cohort with a 95% prediction interval (black dashed line). The blue curve represents the Retrospective Outpatient Pulmonary cohort with a 95% prediction interval (blue dashed line).
