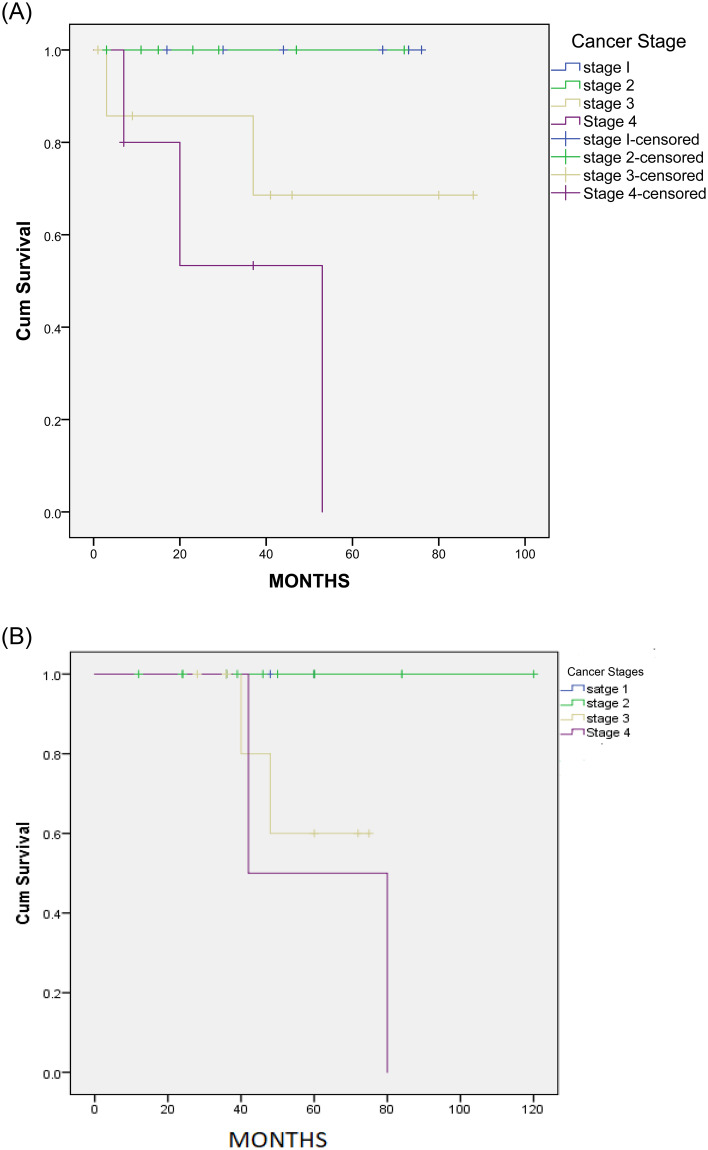
Fig 4. Kaplan-Meier survival curve among asthmatic and control patients.
(A) Kaplan-Meier survival curve showing the speed of the occurrence of death amongst asthma patients who had cancer at different stages. There was no significance in death progression among patients who in stage 1,2, and 3 (P = 0.2) but there were significant between stage 1,2 and 4 (P = 0.01). (B) Kaplan-Meier survival curve showing the speed of the occurrence of death amongst control patients with cancer at different stages.

