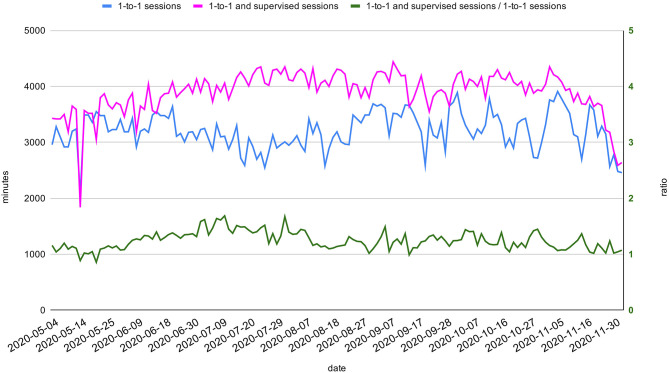
Figure 5.
Total daily minutes of therapy sessions. Total daily minutes of one-to-one and minutes of all sessions (both one-to-one and supervised) between May 2020 and November 2020 (light blue and dark blue on the left axis). The ratio between the two aforementioned quantities (pink) is represented on the right axis.

