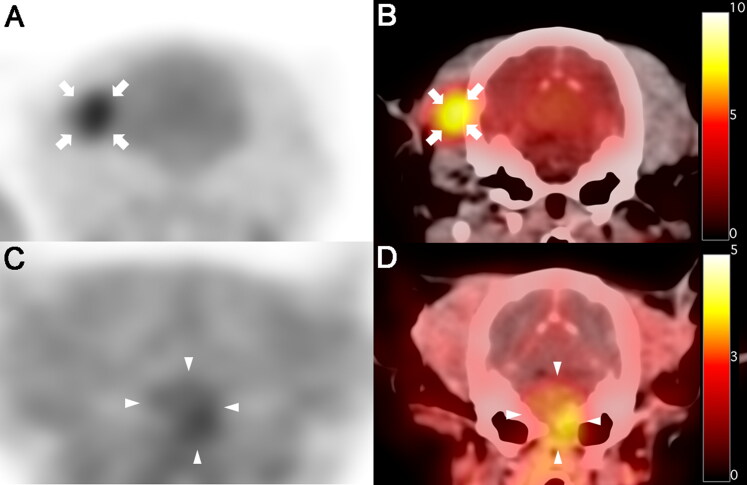
Figure 2.
18F-fluorodeoxyglucose (18F-FDG) and 18F-fluorodopa (18F-FDOPA) positron emission tomography (PET)/CT findings in a dog with astrocytoma. (A, B)18F-FDG PET (A)and PET/CT fusion (B)images on day 569 after initial chemotherapy; no increase was observed in 18F-FDG uptake in the tumor lesion (pons) compared with the surrounding region. High 18F-FDG uptake was incidentally identified in the right temporal muscle (arrows). High 18F-FDG uptake is represented by black and yellow colors on PET and fusion images, respectively, while low 18F-FDG uptake is represented by white and red colors on PET and fusion images, respectively. (C, D)18F-FDOPA PET (C) and PET/CT fusion (D) images on day 1155 after initial chemotherapy; high 18F-FDOPA uptake was observed in the tumor lesion (arrowheads), and bone lysis was also observed in the background CT image. High 18F-FDOPA uptake is represented by black and yellow colors on PET and fusion images, respectively, while low 18F-FDOPA uptake is represented by white and red colors on PET and fusion images, respectively.

