
Fig 3. Reconstructed transmission trees.
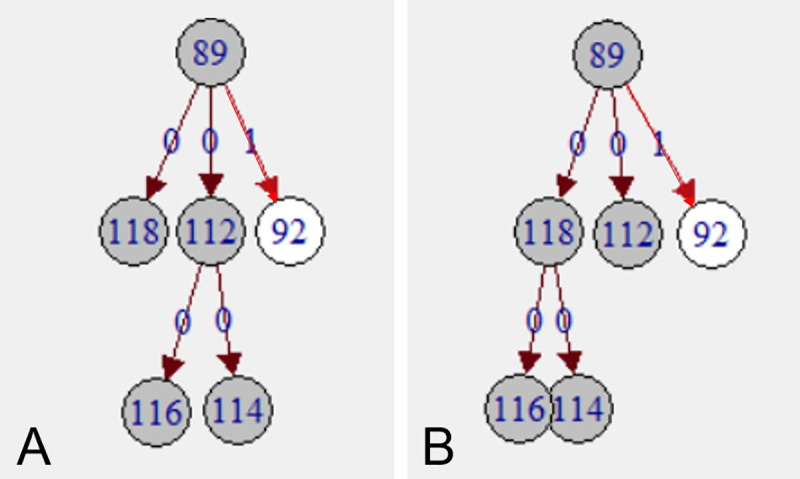
Transmissions are depicted by edges and isolates by vertices in a directed network. Edge labels and edge colour indicate number of SNPs of differences between ancestor and descendant. (A) and (B) two alternatives of potential infection chains of five isolates with identical genotype (dark grey). More alternatives exist.