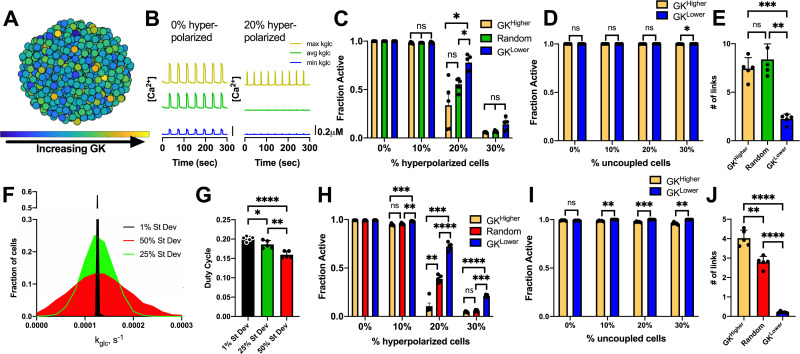
Fig 1. Simulations predicting how variation in GK activity impact islet function.
A). Schematic of unimodal normal distribution of heterogeneous GK activity across simulated islet with 25% variation in GK rate (kglc). B). Representative time courses of [Ca2+] for 3 cells in simulated islet in A. Left is simulation with 0% hyperpolarized cells and right is simulation with a random 20% of cells hyperpolarized. Blue trace is cell with lowest GK rate (kglc), Green is cell with the average GK rate, yellow is cell with the highest GK rate. C). Fraction of cells showing elevated [Ca2+] activity (active cells) in simulated islets vs. the percentage of cells hyperpolarized in islet. Hyperpolarized cells are chosen based on their GK rate. D). Fraction of active cells in islet when cells are uncoupled from the rest of the cells in the simulation. E). # of links from network analysis of [Ca2+] activity with GK 25% variation. F). Histogram showing average frequency of cells at varying GK rate (kglc) for simulations that have different standard deviation in GK activity. G). Average duty cycle of cells from simulations with different standard deviation in GK activity. H). As in C. for simulations with standard deviation in GK activity at 50% of the mean. I). As in D. for simulations with standard deviation in GK activity at 50% of the mean. J). As in E but for simulations with GK 50% variation. Error bars are mean ± s.e.m. Repeated measures one-way ANOVA with Tukey post-hoc analysis was performed for simulations in C and G, Student’s paired t-test was performed for D and H, and one-way ANOVA was performed for F to test for significance. Significance values: ns indicates not significant (p>.05), * indicates significant difference (p < .05), ** indicates significant difference (p < .01), *** indicates significant difference (p < .001), **** indicates significant difference (p < .0001). Data representative of 5 simulations with differing random number seeds.

