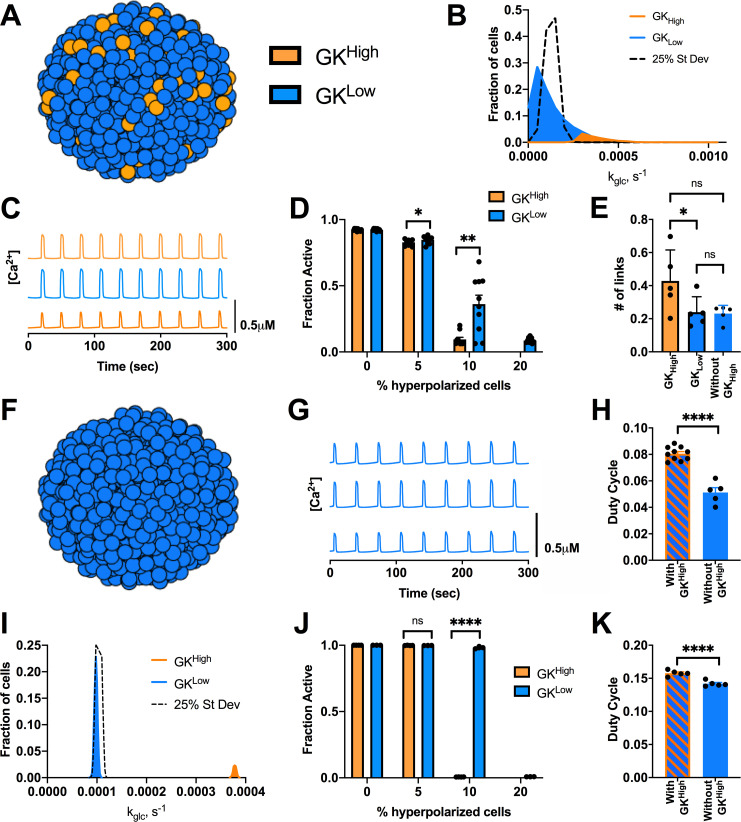
Fig 2. Alternative distributions in GK activity predicts small highly functional cells are dispensable for islet [Ca2+] dynamics.
A). Schematic of altered distributions of GK activity across simulated islet. B). Histogram showing average frequency of cells at varying GK rate (kglc) for skewed distribution compared with normal distribution (25% St Dev). C). Representative time courses of [Ca2+] for 3 cells in simulated skewed islet in A. Blue traces are cells from GKLow population and orange traces are cells from GKHigh population. D). Fraction of cells showing elevated [Ca2+] activity (active cells) in skewed simulations vs. the percentage of cells hyperpolarized in islet. Hyperpolarized cells are chosen either from GKHigh (orange bars) or GKLow (blue bars) population. E). # of links from network analysis of [Ca2+] activity for simulations with skewed distribution of GK F). Schematic of simulation where only GKLow cells are present and no GKHigh cells are included. G). Representative time courses of [Ca2+] for 3 cells in simulated islet in F. H). Average duty cycle of cells from simulations of a skewed distribution model as in A (With GKHigh) and from simulations as in F (Without GKHigh). I). As in B. for bimodal distribution in GK activity where the populations only have 2.5% variation in GK activity. J). As in D. for bimodal distribution in GK activity. K). As in H. but for simulations with no GKHigh from a bimodal distribution. Error bars are mean ± s.e.m. Student’s paired t-test was performed to test for significance. Significance values: ns indicates not significant (p>.05), * indicates significant difference (p < .05), ** indicates significant difference (p < .01), *** indicates significant difference (p < .001), **** indicates significant difference (p < .0001). Data representative of 4–9 simulations with differing random number seeds.

