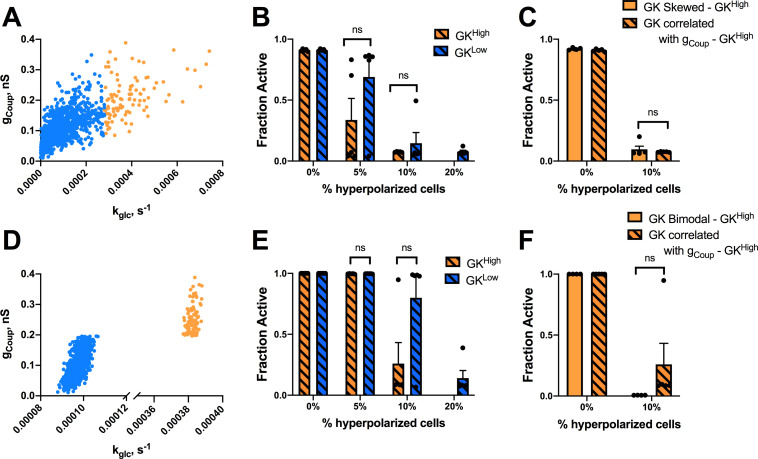
Fig 3. Simulations predicting how changes in coupling impact highly metabolic populations.
A). Scatterplot of gCoup vs. kglc for each cell from a representative simulation where gCoup is correlated with kglc under a skewed distribution in GK activity. B). Fraction of cells showing elevated [Ca2+] activity (active cells) vs. the percentage of cells hyperpolarized in islet from skewed simulations in kglc with correlated gCoup and kglc as in A. Hyperpolarized cells are chosen either from GKHigh (orange bars) or GKLow (blue bars) population. C). As in B. but comparing hyperpolarization in GKHigh cells in the presence and absence of correlations in gCoup. D). as in A but from a simulation where gCoup and kglc are correlated under a bimodal distribution in GK activity. E). As in B. but for simulations where gCoup and kglc are correlated under a bimodal distribution in GK activity. F). As in C. but comparing hyperpolarization in GKHigh cells in the presence and absence of correlations in gCoup under a bimodal distribution in GK activity. Error bars are mean ± s.e.m. Student’s paired t-test was performed for B and E and a Welches t-test for unequal variances was used for C and F to test for significance. Significance values: ns indicates not significant (p>.05), * indicates significant difference (p < .05), ** indicates significant difference (p < .01), *** indicates significant difference (p < .001), **** indicates significant difference (p < .0001). Data representative of 4 simulations with differing random number seeds.

