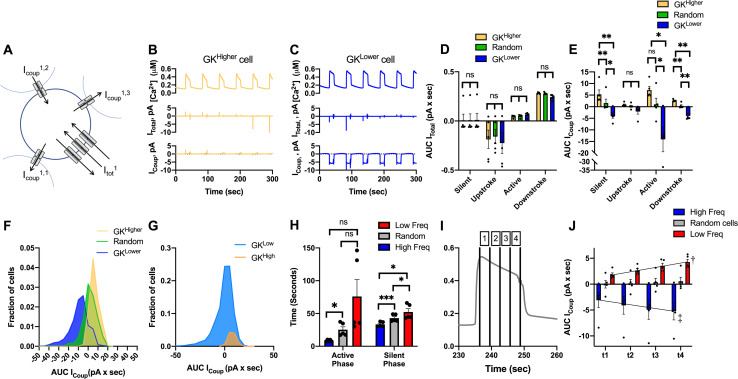
Fig 7. Gap junction current in cells with high/low metabolic activity or oscillation frequency.
A). Schematic of cell within the simulated islet, showing 3 gap junction currents that contribute to the total gap junction current, together with the total membrane current. B). Time course of [Ca2+] from a cell, together with the total membrane current and total gap junction current for a representative cell with higher metabolic activity (kglc). C). As in B for a representative cell with lower metabolic activity. D). Total membrane current, as expressed by an area under the curve (AUC), for each phase of the [Ca2+] oscillation averaged over the 10% of cells with highest or lowest kglc or a random 10% of cells. E). As in D for total gap junction current. F). Distribution of total gap junction current, as expressed by AUC, for the 10% of cells with highest or lowest kglc or a random 10% of cells. G). As in E for a bimodal distribution in kglc. H). Mean duration of active phase and silent phase averaged over the 10% of cells with highest or lowest oscillation frequency, or a random 10% of cells. I). Mean islet [Ca2+] time course showing different portions of the active phase (1–4). J). Mean islet gap junction current during different portions of the active phase, as indicated in I for the 10% of cells with highest or lowest oscillation frequency, or a random 10% of cells. Black lines are fitted regression lines. Error bars are mean ± s.e.m. Repeated measures one-way ANOVA was performed for data in D, E, H to test for significance. Linear regression was performed on data in J. Significance values: ns indicates not significant (p>.05), * indicates significant difference (p < .05), ** indicates significant difference (p < .01), *** indicates significant difference (p < .001), **** indicates significant difference (p < .0001), † indicates significant linear regression (p < .05), ‡ indicated significant linear regression (p < .01). Data representative of 5 simulations with differing random number seeds.

