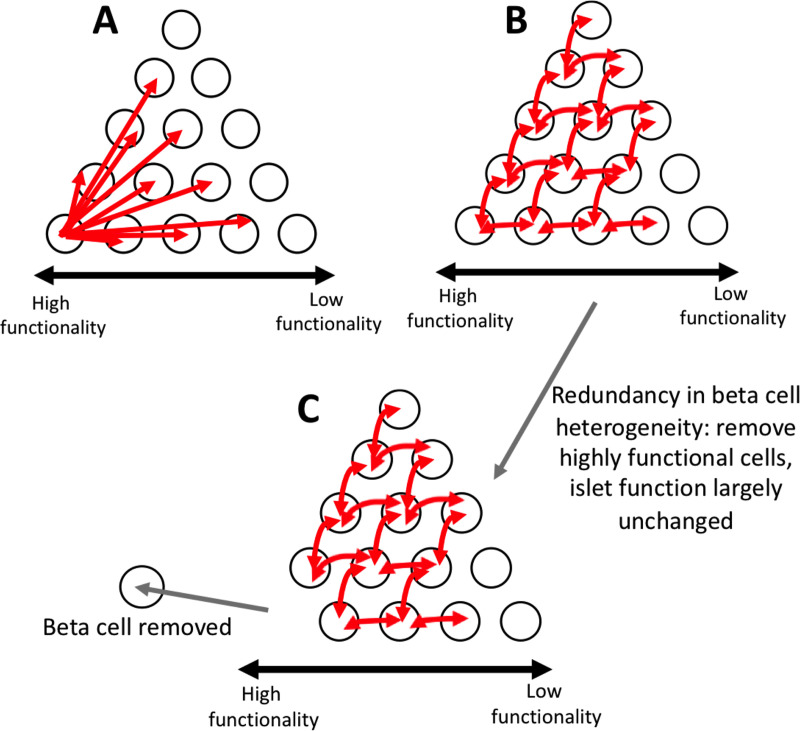
Fig 8. Schematic of multicellular dynamics of the islet.
A). Schematic of suggestion that small subpopulations of highly functional cells can control whole islet dynamics. White circles represent β-cells. Red arrows represent which cells can be controlled by individual cell where the arrow begins. Increasing functionality in cells is from right to left B). Same as A, but a schematic of how our simulations predict islet [Ca2+] dynamics are controlled. Our simulations predict that control is redundant, and many cells can control many other cells. Our simulations predict there is not one small subpopulation that controls the entire islet. C). Same as B, but schematic of how our simulations predict the islet responds when highly functional subpopulations are removed. When highly functional subpopulations are removed, the remaining cells are able to maintain the function of the islet due to the redundancy in control.

