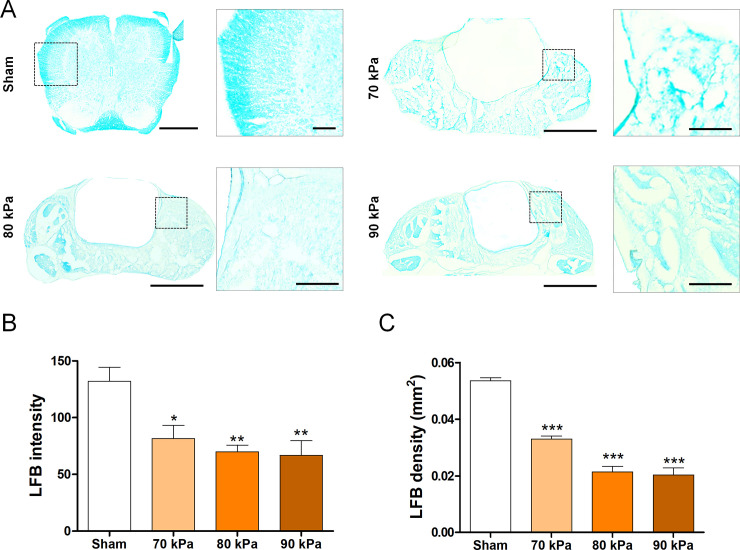
Fig 3. Demyelination assessment using the LSS model.
(A) Representative LFB-stained images of the myelin sheath in the sham and LSS groups. Scale bars = 1 mm and 100 μm. (B, C) Quantitative analyses of (B) pixel intensity and (C) density in LFB-stained myelin sheaths (n = 4 per group). Data are expressed as the means ± SEM. *P < 0.05, **P < 0.01, and ***P < 0.001 compared with the sham group analyzed by a one-way ANOVA with Tukey’s post-hoc test.

