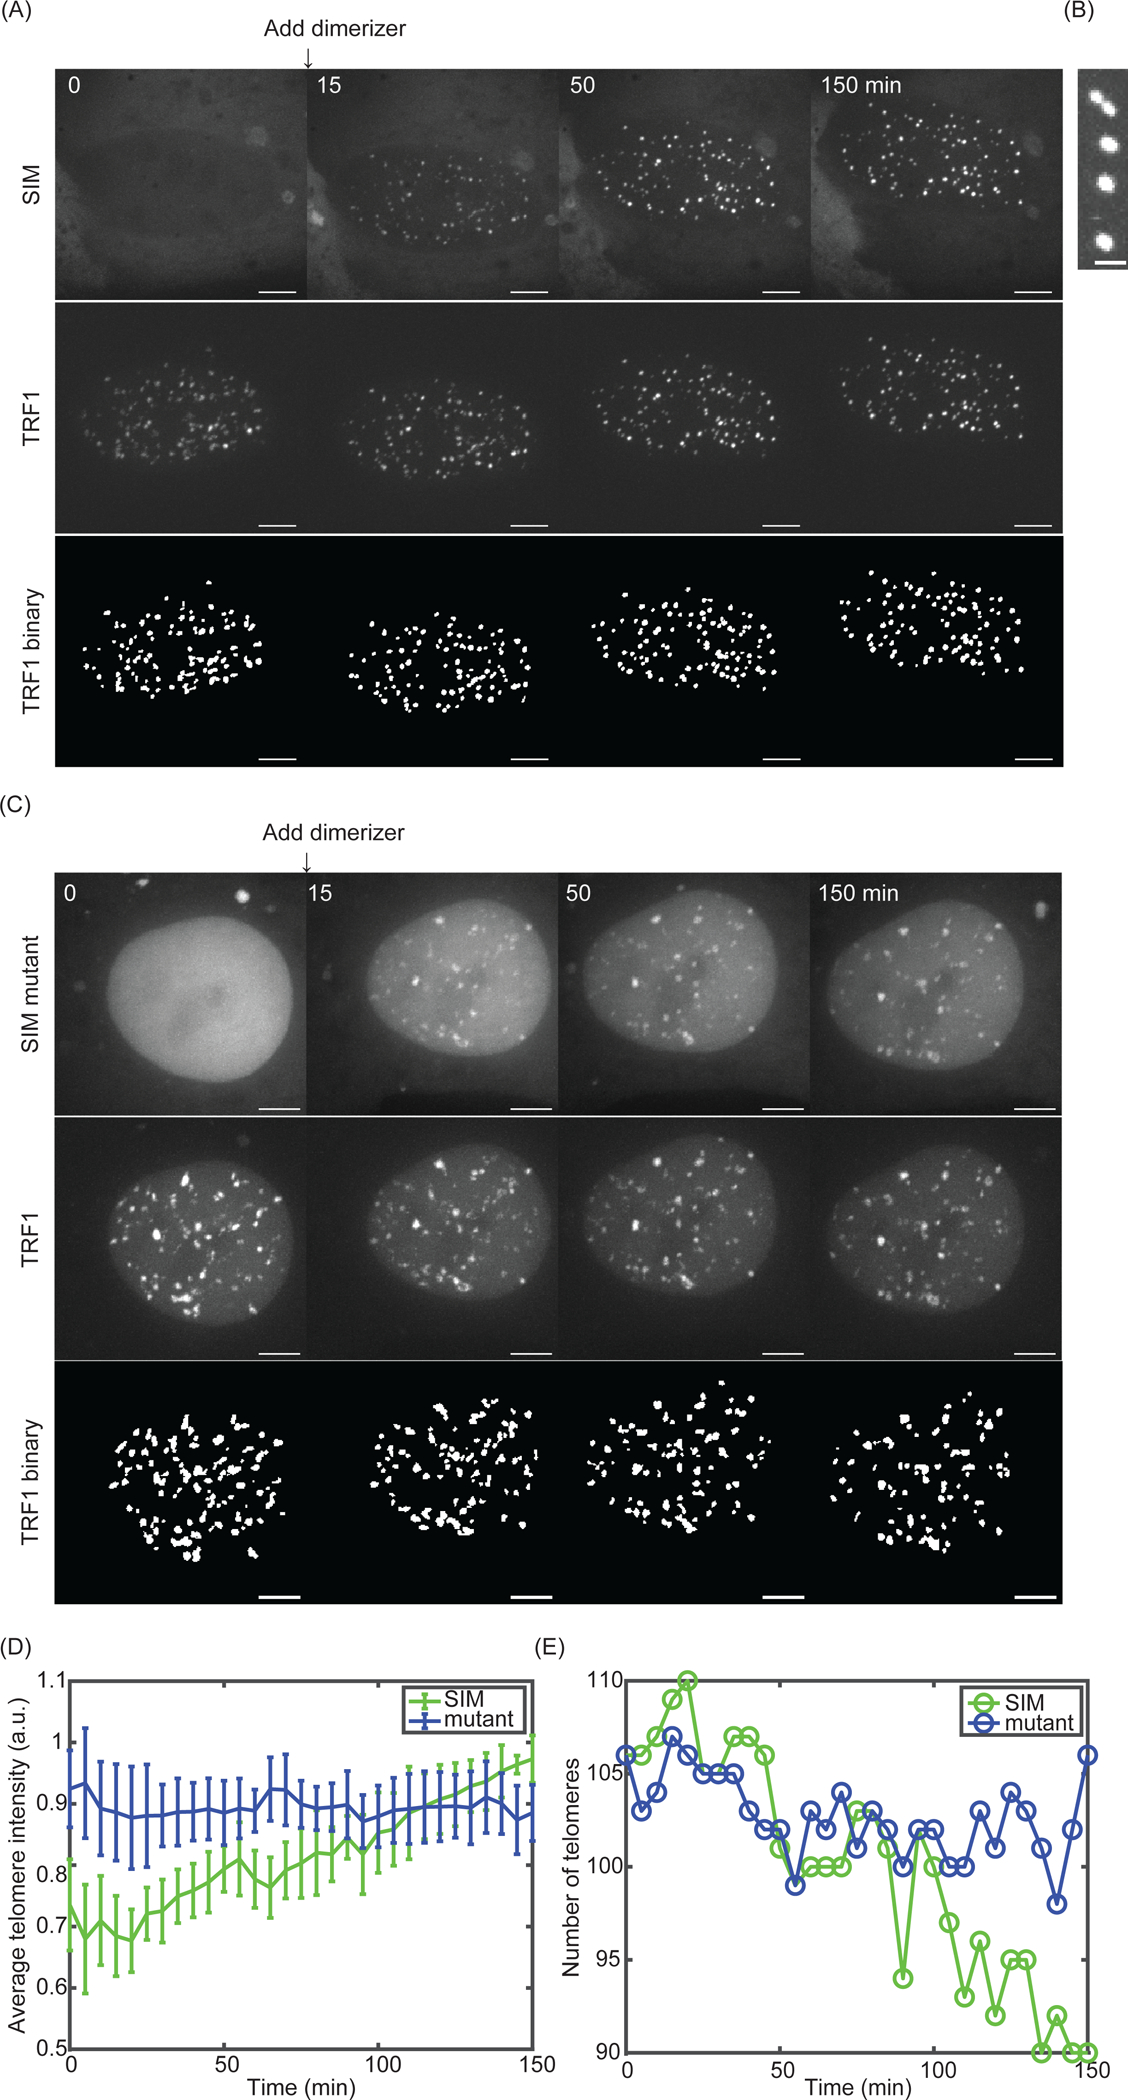
Figure 3: Dimerization-induced phase separation drives telomere clustering.

(A) Snapshots of TRF1-GFP and SIM-mCherry before and after adding 100 nM dimerizer (final concentration). AT the bottom is the telomere binary layer identified from TRF1-GFP. Scale bars, 5 μm. (B) A fusion event after recruiting SIM to telomeres. Scale bars, 2 μm. Time interval, 5 mins. (C) Snapshots of TRF1-GFP and SIM mutant-mCherry before and after adding 100 nM dimerizer (final concentration). At the bottom is the telomere binary layer identified from TRF1-GFP. Scale bars, 5 μm. (D) Average telomere intensity (summarize intensity over the volume in each telomere and then average over all telomeres in a cell) over time after recruiting SIM (green, for cell in Figure 3A) and SIM mutant (blue, for cell in Figure 3C). (E) Telomere number over time after recruiting SIM (green, for cell in Figure 3A) and SIM mutant (blue, for cell in Figure 3C).
