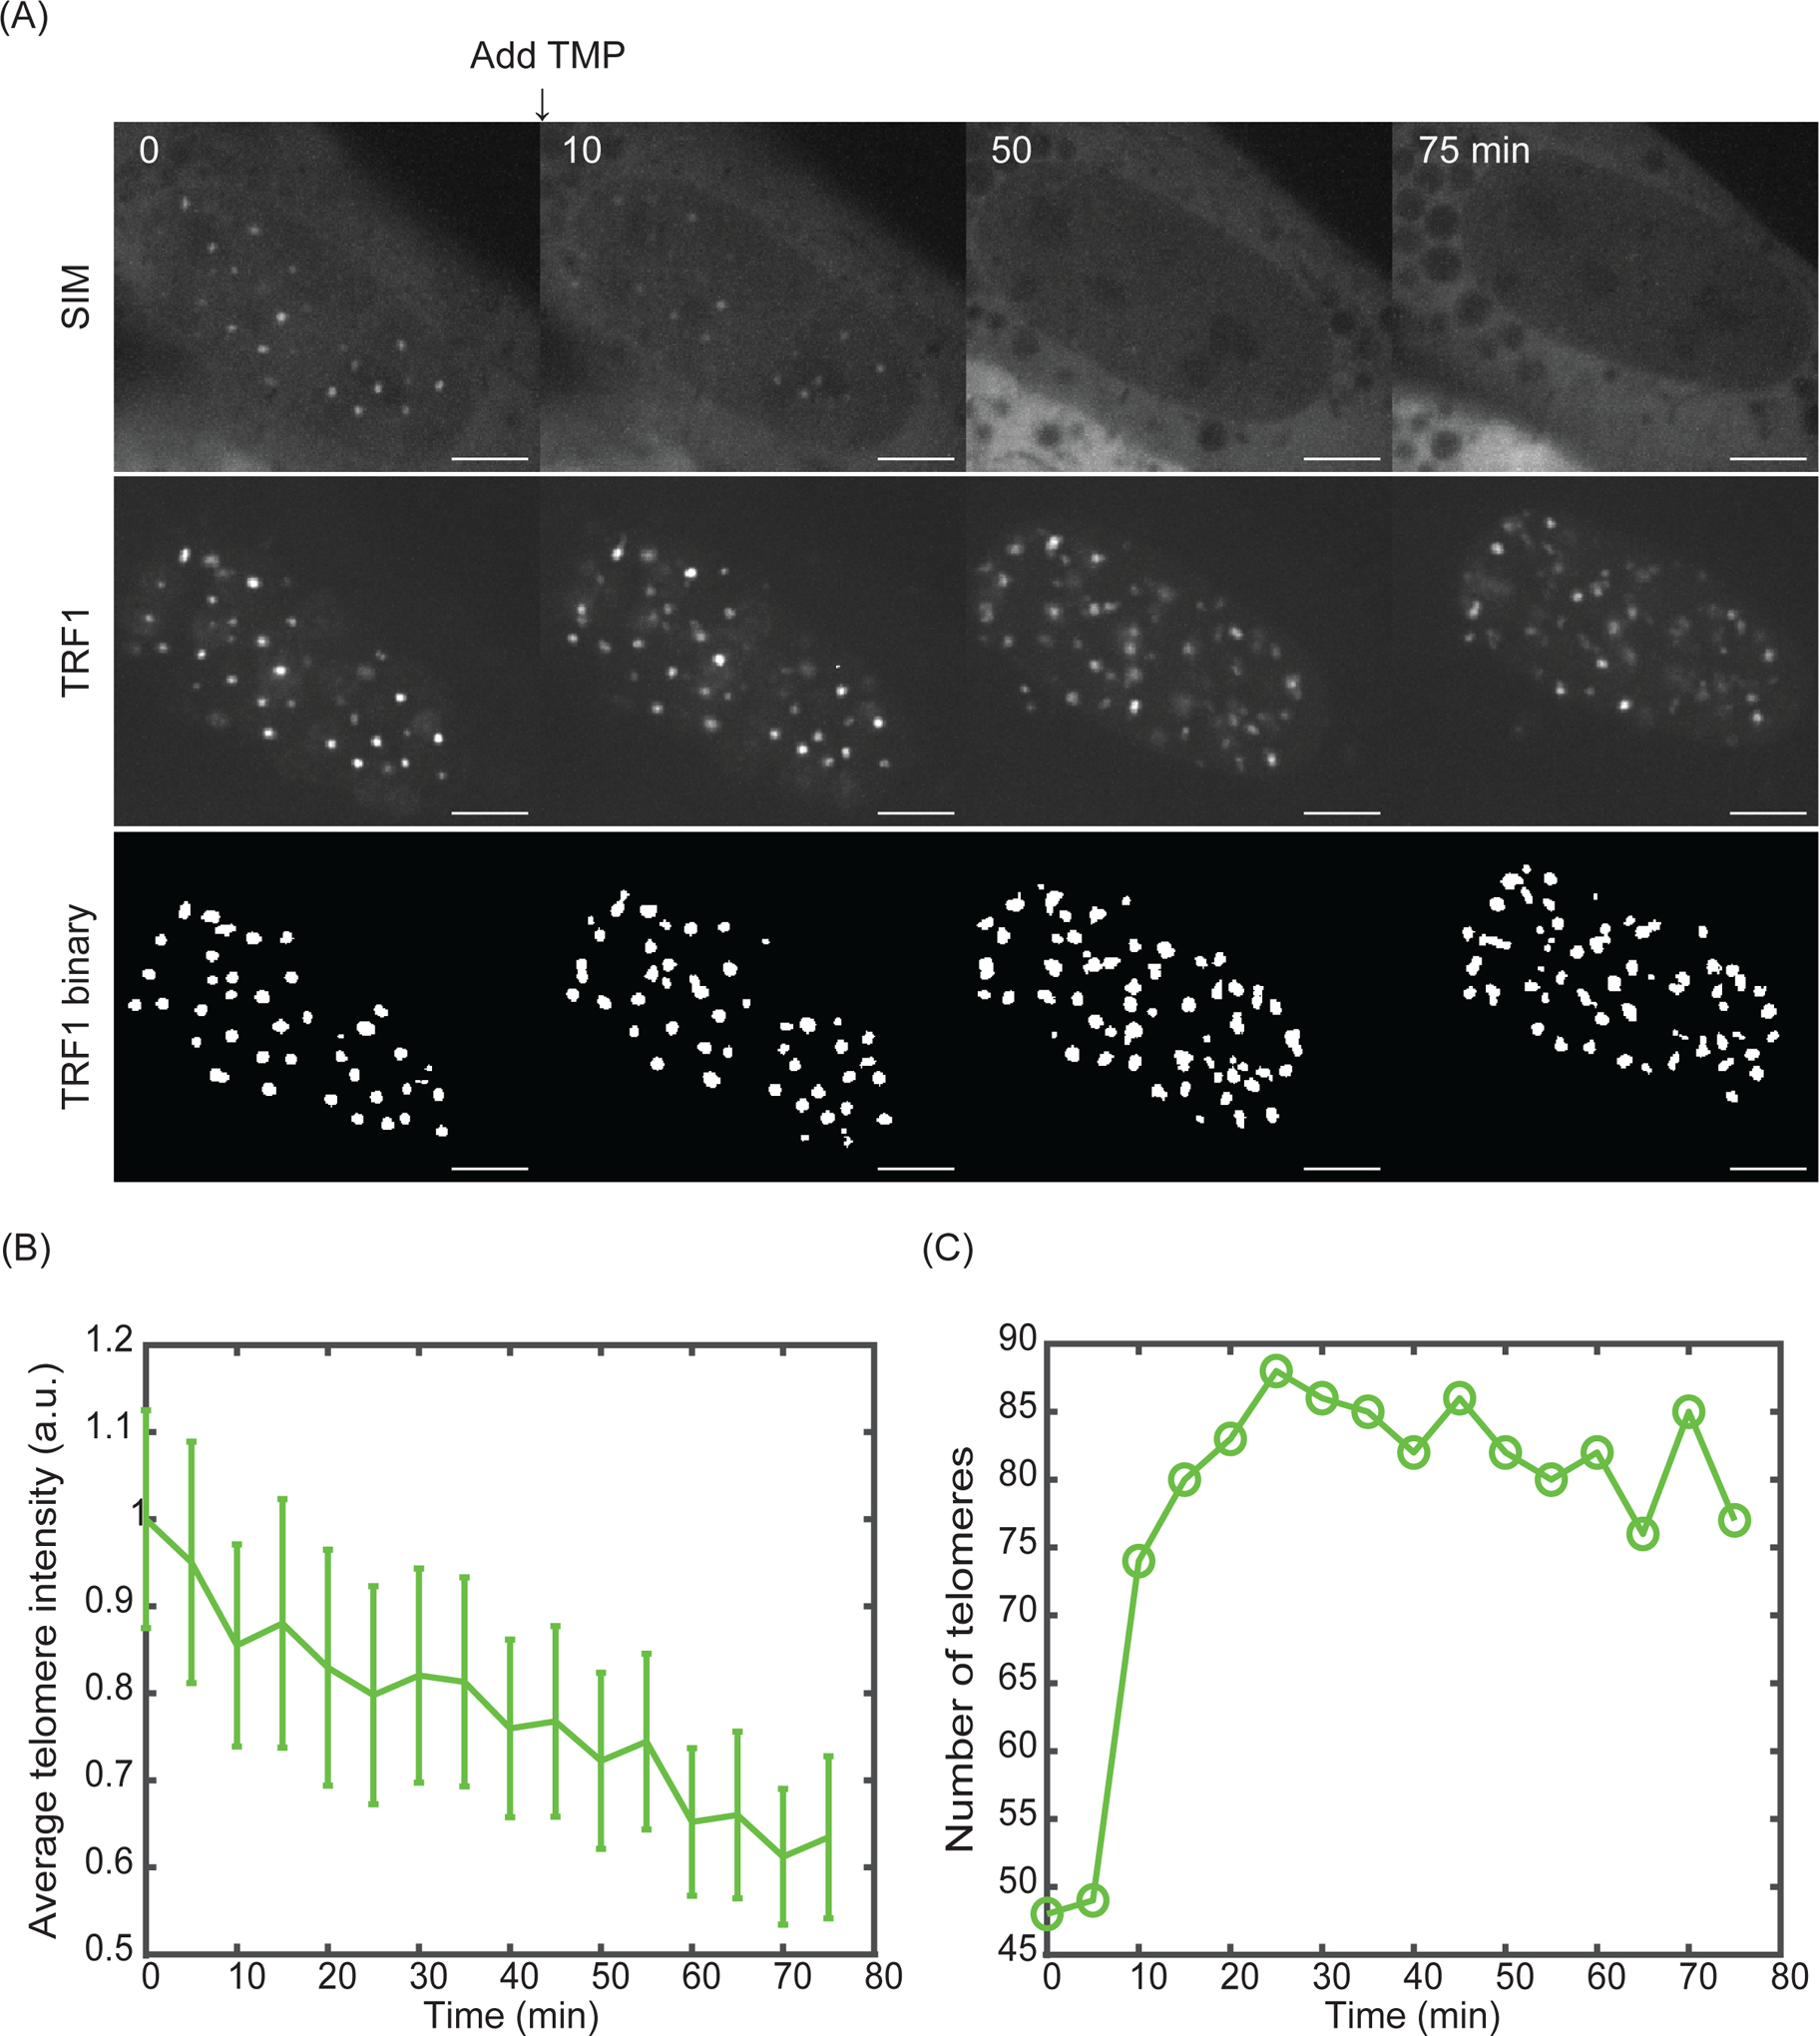
Figure 4: Reversal of condensation and telomere clustering.

(A) Snapshots of TRF1-GFP and SIM-mCherry after adding 100 μM TMP (final concentration) to cells with condensates formed for 3 hours. At the bottom is the telomere binary layer identified from TRF1-GFP. Scale bars, 5 μm. (B) Average telomere intensity (summarize intensity over the volume in each telomere and then average over all telomeres in a cell) over time for cell in Figure 4A. (C) Telomere number over time for cell in Figure 4A.
