
Table 3.
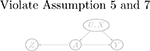
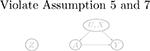
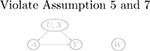
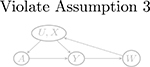
Examples of graphs for Z, A, U relationships and for W, Y, U relationships. The two pieces of graphs can be combined in to a directed acyclic graph that encodes the negative control assumptions. Gray-colored graphs are invalid because of violation of key assumptions
| Examples of graphs for Z, A, U relationships | |||
| Z → A (pre-treatment) | A → Z (post-treatment) | Z ⫫ A | |
| No arrow between U and Z (may violate Assumption 5 and 7) | 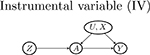 |
 |
 |
| U → Z | 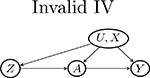 |
 |
 |
| Z → U | May violate Assumption 4 if there is W → U | ||
| Examples of graphs for W, Y, U relationships | |||
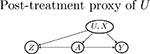
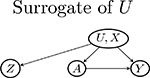
| W → Y (a) | Y (a) → W (violate Assumptions 3 and 4) | Y (a) ⫫ W | (U, X) | |
| No arrow between U and W (violate Assumption 5 and 7) | 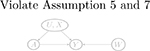 |
 |
|
| U → W | 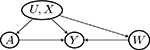 |
 |
|
| May violate Assumption 4 if there is Z → U | |||
| W → U | 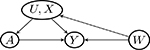 |
 |
|