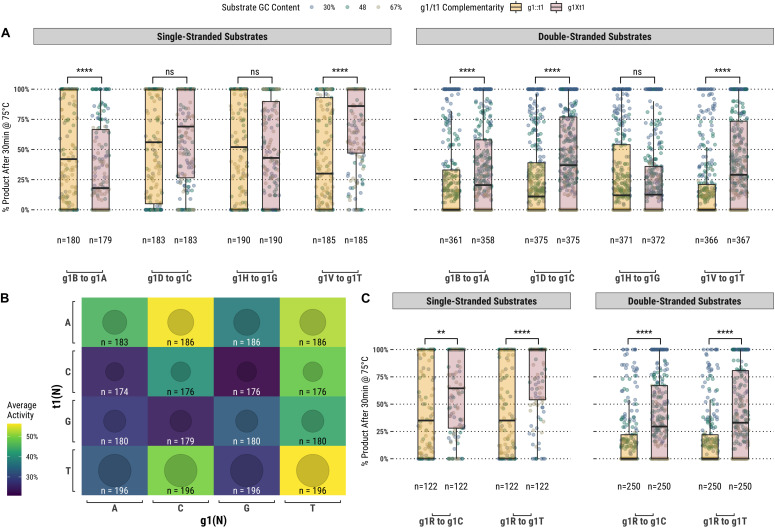
FIGURE 3.
(A) Comparison of fully-complementary g1B/D/H/V guides to partially-complementary (g1 not complementary to t1) g1A/C/G/T guides. (B) A heatmap comparing the average activity of all g1-t1 combinations with single- and double-stranded substrates. (C) Comparing partially-complementary g1C and g1T guides to the same population of fully-complementary g1R guides. Boxplots have been annotated for statistical significance between relevant groups using the following labels: ns (not significant) for p > 0.05; ∗∗ for p ≤ 0.01; and **** for p ≤ 0.0001.

