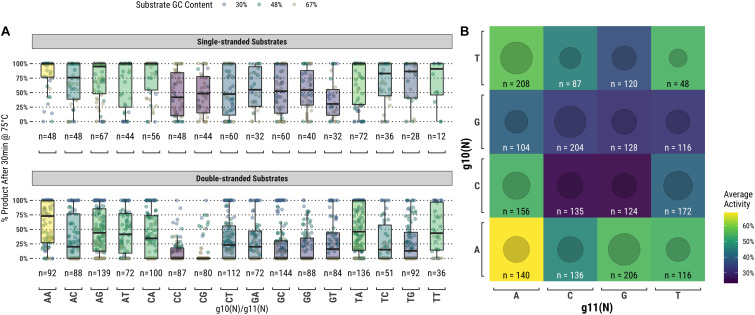
FIGURE 5.
TtAgo shows a preference for low GC content dinucleotides at the g10/g11 positions which align with the enzyme active site. (A) Populations expressed as box plots individually for single- and double-stranded substrates. (B) Single- and double-stranded substrates combined and expressed as a heatmap.

