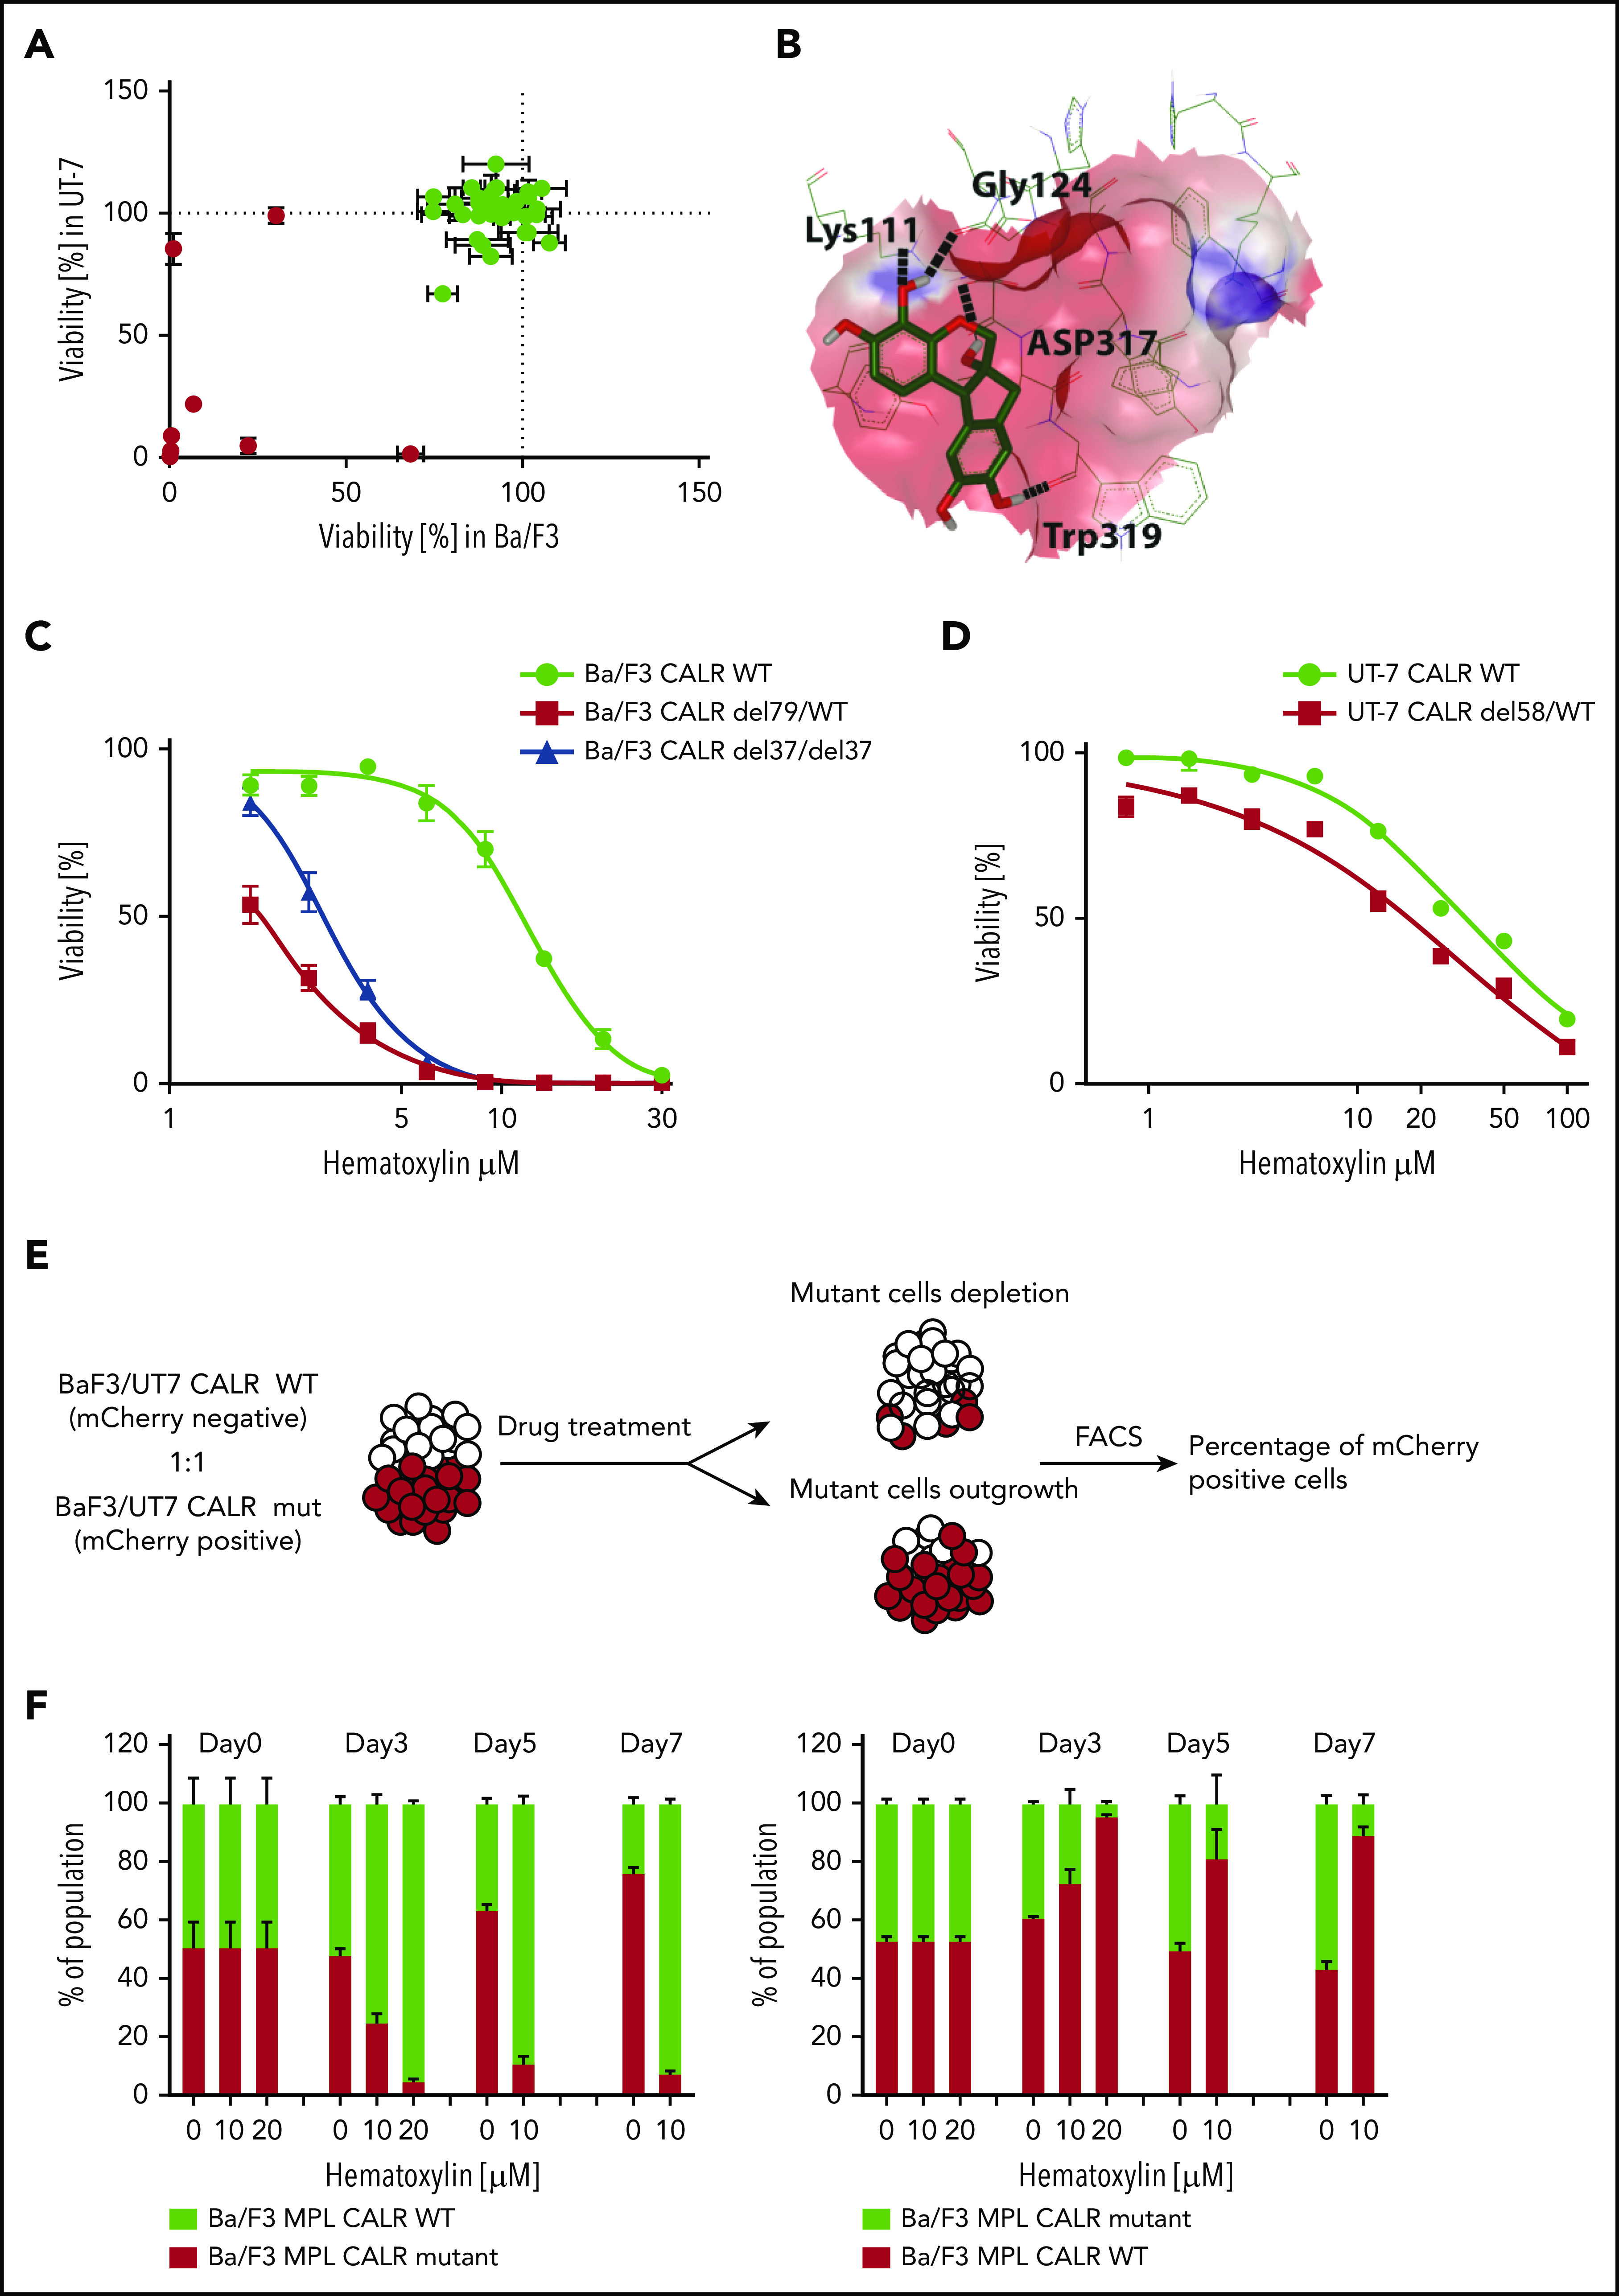
Figure 2.

Selective inhibitory effect of hematoxylin was observed on CALR-mutated cell lines. (A) Single-dose cytotoxic screen of the docking library in Ba/F3-MPL and UT-7/TPO cell lines. CRISPR-Cas9–generated Ba/F3-MPL CALR del79/WT and UT-7/TPO CALR del61/WT were treated by each compound at 10 μM for 72 hours. All luminescent signals were normalized to DMSO control to calculate the percentage of reduced viability (n = 3). Positive hits are shown in red. Data are shown as mean ± standard deviation (SD). (B) Molecular docking model of hematoxylin with the GBD of CALR. The predicted interacting amino acid residues are labeled. The hydrogen bonds are labeled with black dash lines. The pink area indicates the grid box used in the docking study. (C) Dose-response test of hematoxylin in Ba/F3-MPL cell lines. A heterozygous and a homozygous CALR-mutated cell line were used in comparison with WT control. WT cells were grown with 1% TPO-conditioned media, and mutant cell lines were grown without cytokine. All drug treatment groups contained an equal amount of DMSO (n = 6). (D) Dose-response test of hematoxylin in UT-7/TPO cell lines. A CALR heterozygous mutant cell line was used in comparison with WT control. WT cells were grown with 1% TPO-conditioned media, and mutant cell lines were grown without cytokine. All drug treatment groups contained an equal amount of DMSO (n = 6). (E) Schematic diagram of the experimental process of the 2-color competition assay. (F) Drug selectivity test of hematoxylin in Ba/F3-MPL by the 2-color competition assay. Ba/F3-MPL CALR WT (mCherry+) and Ba/F3-MPL CALR del79/WT (mCherry−) cells were treated with the indicated concentration of hematoxylin for 7 days (1% TPO-conditioned media) and, the drug was refreshed every 2 to 3 days (left). The reverse color setting was used, and Ba/F3-MPL CALR WT (mCherry−) and Ba/F3-MPL CALR del79/WT (mCherry+) cells were used (right; n = 3). Data are shown as mean ± SD. FACS, fluorescence-activated cell sorting.
