. 2021 Apr 20;10:e66537. doi: 10.7554/eLife.66537

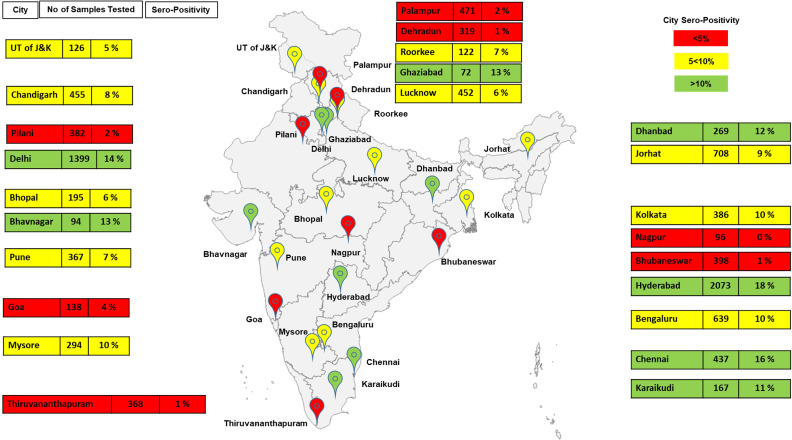
Figure 1. Demographics of serosurvey (India map may not be to scale and is for representation purposes only and seropositivity is rounded off).

Figure 1.

Figure 1—source data 1. Data for all labs/centers utilized for Figure 2A,B.
Lab, district, and date of collection (DOC) (columns A–C), total samples collected, number of seropositive samples, seropositivity in percentage (rounded off), and number of samples tested and found positive for neutralizing antibody (NAB). Columns (E–I) Number of confirmed cases and tests done for respective states 15 days and prior and after the DOC. Columns (L–N) Data obtained from http://www.covid19India.org. State data has been utilized as a surrogate to city/district data for city/district data was not available for number of cases/tests done for many.