. 2021 Apr 26;10:e67612. doi: 10.7554/eLife.67612

Figure 4. Scatter plots of the first principal components (PC) in neonate Longshanks and Control cranium Procrustes shape variables at generation 32 (F32).

Left: Plot of litter size adjusted Procrustes shape variables (left), large symbols indicate mean PC1 and PC2 scores for each respective cohort. Shapes of individual points indicate Longshanks lines (circle = CTL, square = LS1, and triangle = LS2). Right: Neonate cranium with vectors of shape change at each cranium landmark (magnified four times for visualization) showing shape transformations along PC1 (top) and along PC2 (bottom) from negative to positive scores.

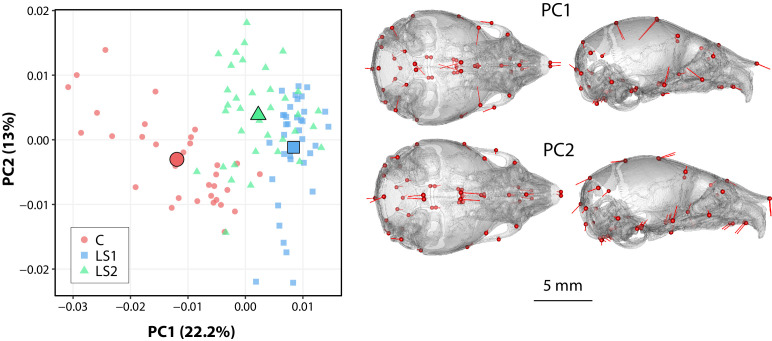
Figure 4—source data 1. Neonate morphometric and landmark data.
elife-67612-fig4-data1.xlsx (223.2KB, xlsx)

Figure 4.

Figure 4—figure supplement 1. Boxplots showing differences in neonate Longshanks and Control metrics.

Figure 4—figure supplement 1.

(A) Boxplot of neonate litter sizes. (B and C) Boxplots of litter size adjusted tibia length and cranium centroid size.
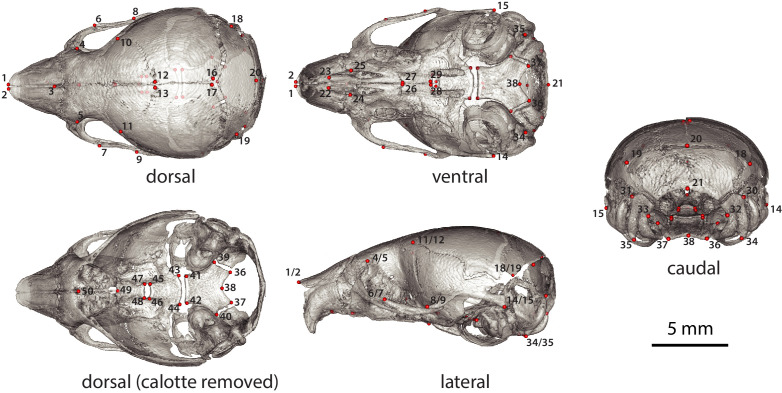
Figure 4—figure supplement 2. Neonate (P07) cranium landmarks used in this study in lateral, dorsal, dorsal cranial base, caudal, and ventral landmark views.

Figure 4—figure supplement 2.

For landmark anatomical definitions, see Supplementary file 5.