. 2021 Apr 20;10:e61138. doi: 10.7554/eLife.61138

Figure 1. Declines in muscle structure are subtle until advanced age.

(A) Tibialis anterior (TA) muscle weight as a percentage of whole-body weight in young (3–6 months), middle-aged (10-14 months), old (21-24 months), and oldest-old (27-29 months) male (N = 57) and female mice (N = 78, one-way ANOVAs). (B) Average fiber cross-sectional area of uninjured male (N = 27) and female (N = 24) mouse TAs across age groups (one-way ANOVAs). (C) Representative images of TA sections stained for laminin (gray), type IIA (purple), type IIX (black/unstained), and type IIB (red) fibers (top, main scale bars = 500 μm, inset scale bars = 250 μm ); Masson’s trichrome staining (middle, 50 µm); and lipidtox staining (bottom, lipidtox = red, laminin = green, scale bars = 50 µm). (D) Percentage of IIA and IIX fibers in the whole TA cross-section of male (N = 27) and female (N = 24) mice (one-way ANOVAs). (E) Collagen area of TA sections across ages and sexes (male N = 17, female N = 19) quantified by Masson’s Trichrome staining (one-way ANOVAs). (F) Intermuscular lipid accumulation in the TA across ages and sexes (male N = 16, female N = 15) quantified by lipidtox staining (one-way ANOVA). (G) Intramuscular lipid accumulation in the TA across ages and sexes (male N = 16, female N = 15) quantified by lipidtox staining (one-way ANOVA). All data presented as mean ± SD (*p<0.05, **p<0.01, ***p<0.001, ****p<0.0001).

Figure 1.

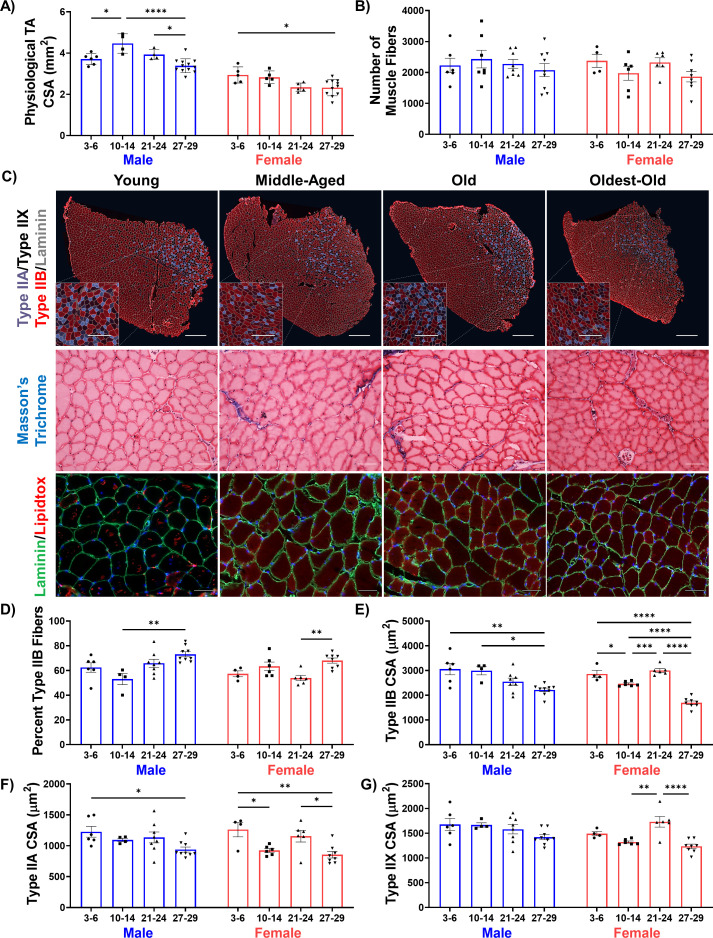
Figure 1—figure supplement 1. Characterization of sarcopenic changes in male mice.

Figure 1—figure supplement 1.

(A) Physiological TA cross-sectional area (CSA) estimated from length and mass measurements in young (3–6 months), middle-aged (10-14 months), old (21-24 months), and oldest-old (27-29 months) male (N = 26) and female (N = 26) C57BL/6J mice across ages and sexes (one-way ANOVAs). (B) Total number of TA muscle fibers in whole TA sections across ages and sexes (male N = 27, female N = 24). (C) Representative images of male uninjured TA muscles showing fiber type staining for type IIA (purple), type IIX (black/unstained), type IIB (red), and laminin (gray, main scale bars = 500 μm, inset scale bars = 250 μm), and Masson’s trichrome staining. (D) Percentage of type IIB muscle fibers in whole TA muscle sections (male N = 27, female N = 24, one-way ANOVA). (E) Type IIB fiber CSA (male N = 27, female N = 24, one-way ANOVA). (F) Type IIA fiber CSA (male N = 27, female N = 24, one-way ANOVA). (G) Type IIX fiber CSA (male N = 27, female N = 24, one-way ANOVA). All data presented as mean ± SD (*p<0.05, **p<0.01, ***p<0.001, ****p<0.0001).
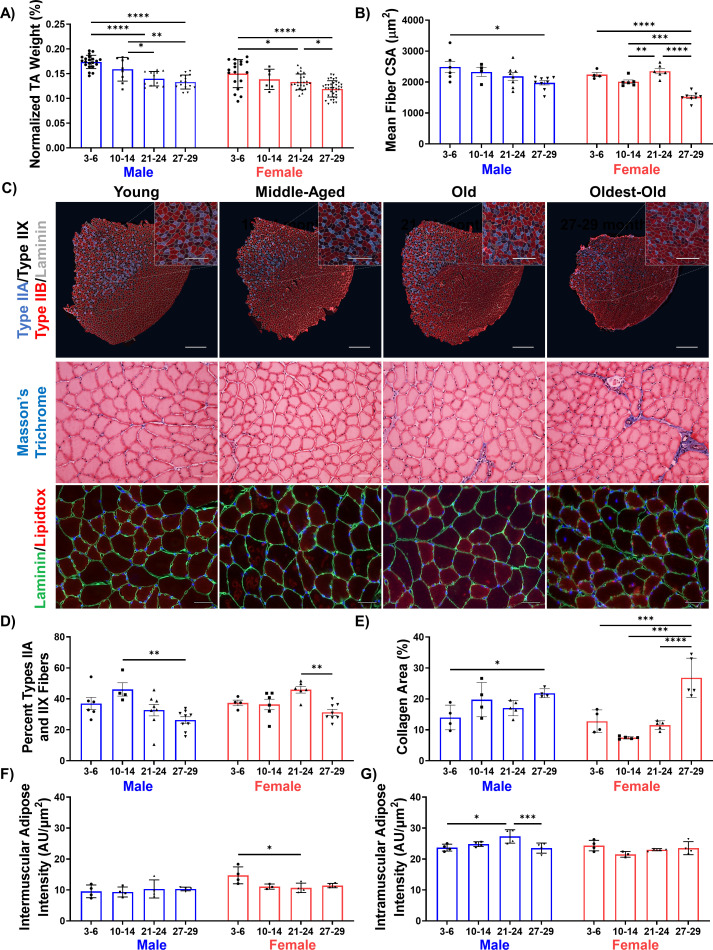
Figure 1—figure supplement 2. Denervation gene expression in mice across age groups for Musk (N = 28), Ncam1 (N = 27), and Runx1 (N = 29).

Figure 1—figure supplement 2.

Data collected from the Tabula Muris Senis database. Blue dots represent male data. Red dots represent female data (one-way ANOVAs). All data presented as mean ± SD (*p<0.05, **p<0.01).