. 2021 Apr 20;10:e61138. doi: 10.7554/eLife.61138

Figure 7. The effect of AAV-Kl administration on genes associated with hallmarks of aging is age-dependent.

(A) Venn Diagram showing the number of differentially expressed (DE) genes between groups treated with AAV-Kl (n = 4) vs AAV-GFP (n = 4) mice. (B) Network plot with each node as a pie chart that denotes the total number of DE genes in that hallmark, and the wedges denote the proportion of DE genes between groups treated with AAV-Kl vs AAV-GFP for each hallmark of aging. The edge weights denote the number of genes that are common between the two connected hallmarks. The node sizes are proportional to the number of genes that fall into each hallmark. (C) Barplots showing GO terms associated with old vs old klotho (green), and oldest-old vs oldest-old klotho (yellow) DE genes. (D) Bar plot showing the top 20 KEGG pathways that change oppositely between old and oldest-old groups after AAV-Kl treatment ranked by largest absolute difference in total accumulation. Total accumulation is a measure of gene perturbation.

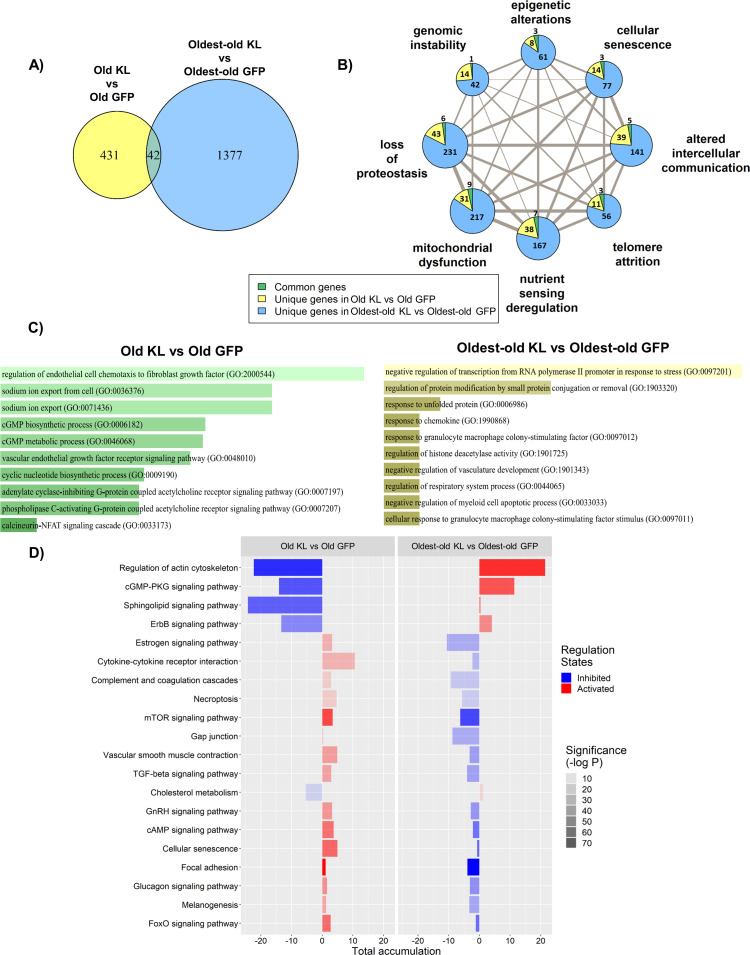
Figure 7—source data 1. Raw Data for Figure 7—figure supplement 1A-C.

Figure 7.

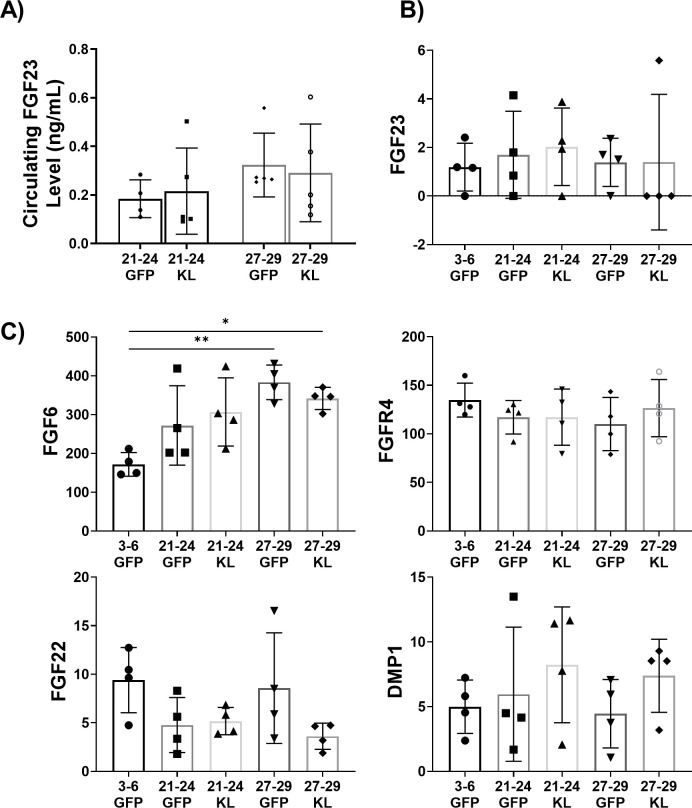
Figure 7—figure supplement 1. Investigation of the Klotho-FGF23 interaction in uninjured female mice with AAV-Kl treatment.

Figure 7—figure supplement 1.

(A) Circulating FGF23 in the serum of old (21–24 months, N = 9) and oldest-old (27-29 months N = 10) female mice treated with GFP or AAV-Kl. (B) Gene count normalized to library size for FGF23 in the gastroc of old and oldest-old female mice treated with GFP or AAV-Kl compared to young (3–6 months) female mice treated with GFP (N = 20). (C) Gene count normalized to library size for primary interactors of FGF23 (N = 20, one-way ANOVA). All data presented as mean ± SD (*p<0.05, **p<0.01).
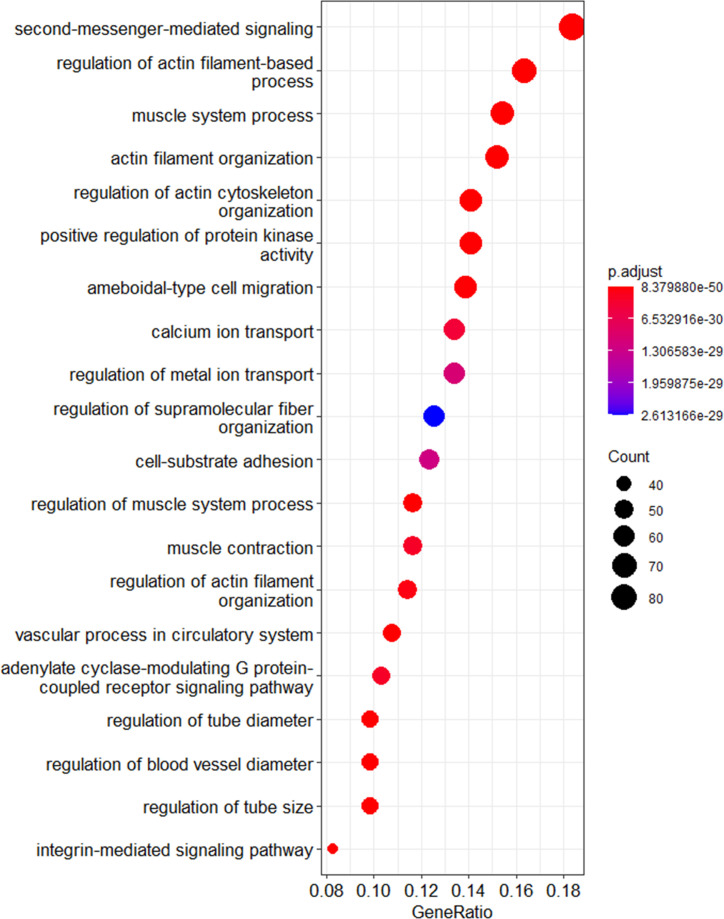
Figure 7—figure supplement 2. Dot plot of GO terms showing age-dependency of calcium ion transport and signaling with Klotho intervention.

Figure 7—figure supplement 2.

These are GO terms associated with top three pathways differently perturbed between old and oldest-old mice with AAV-Kl intervention. The size of the circle represents the number of genes that are associated with each of the GO term.