
Figure 1.
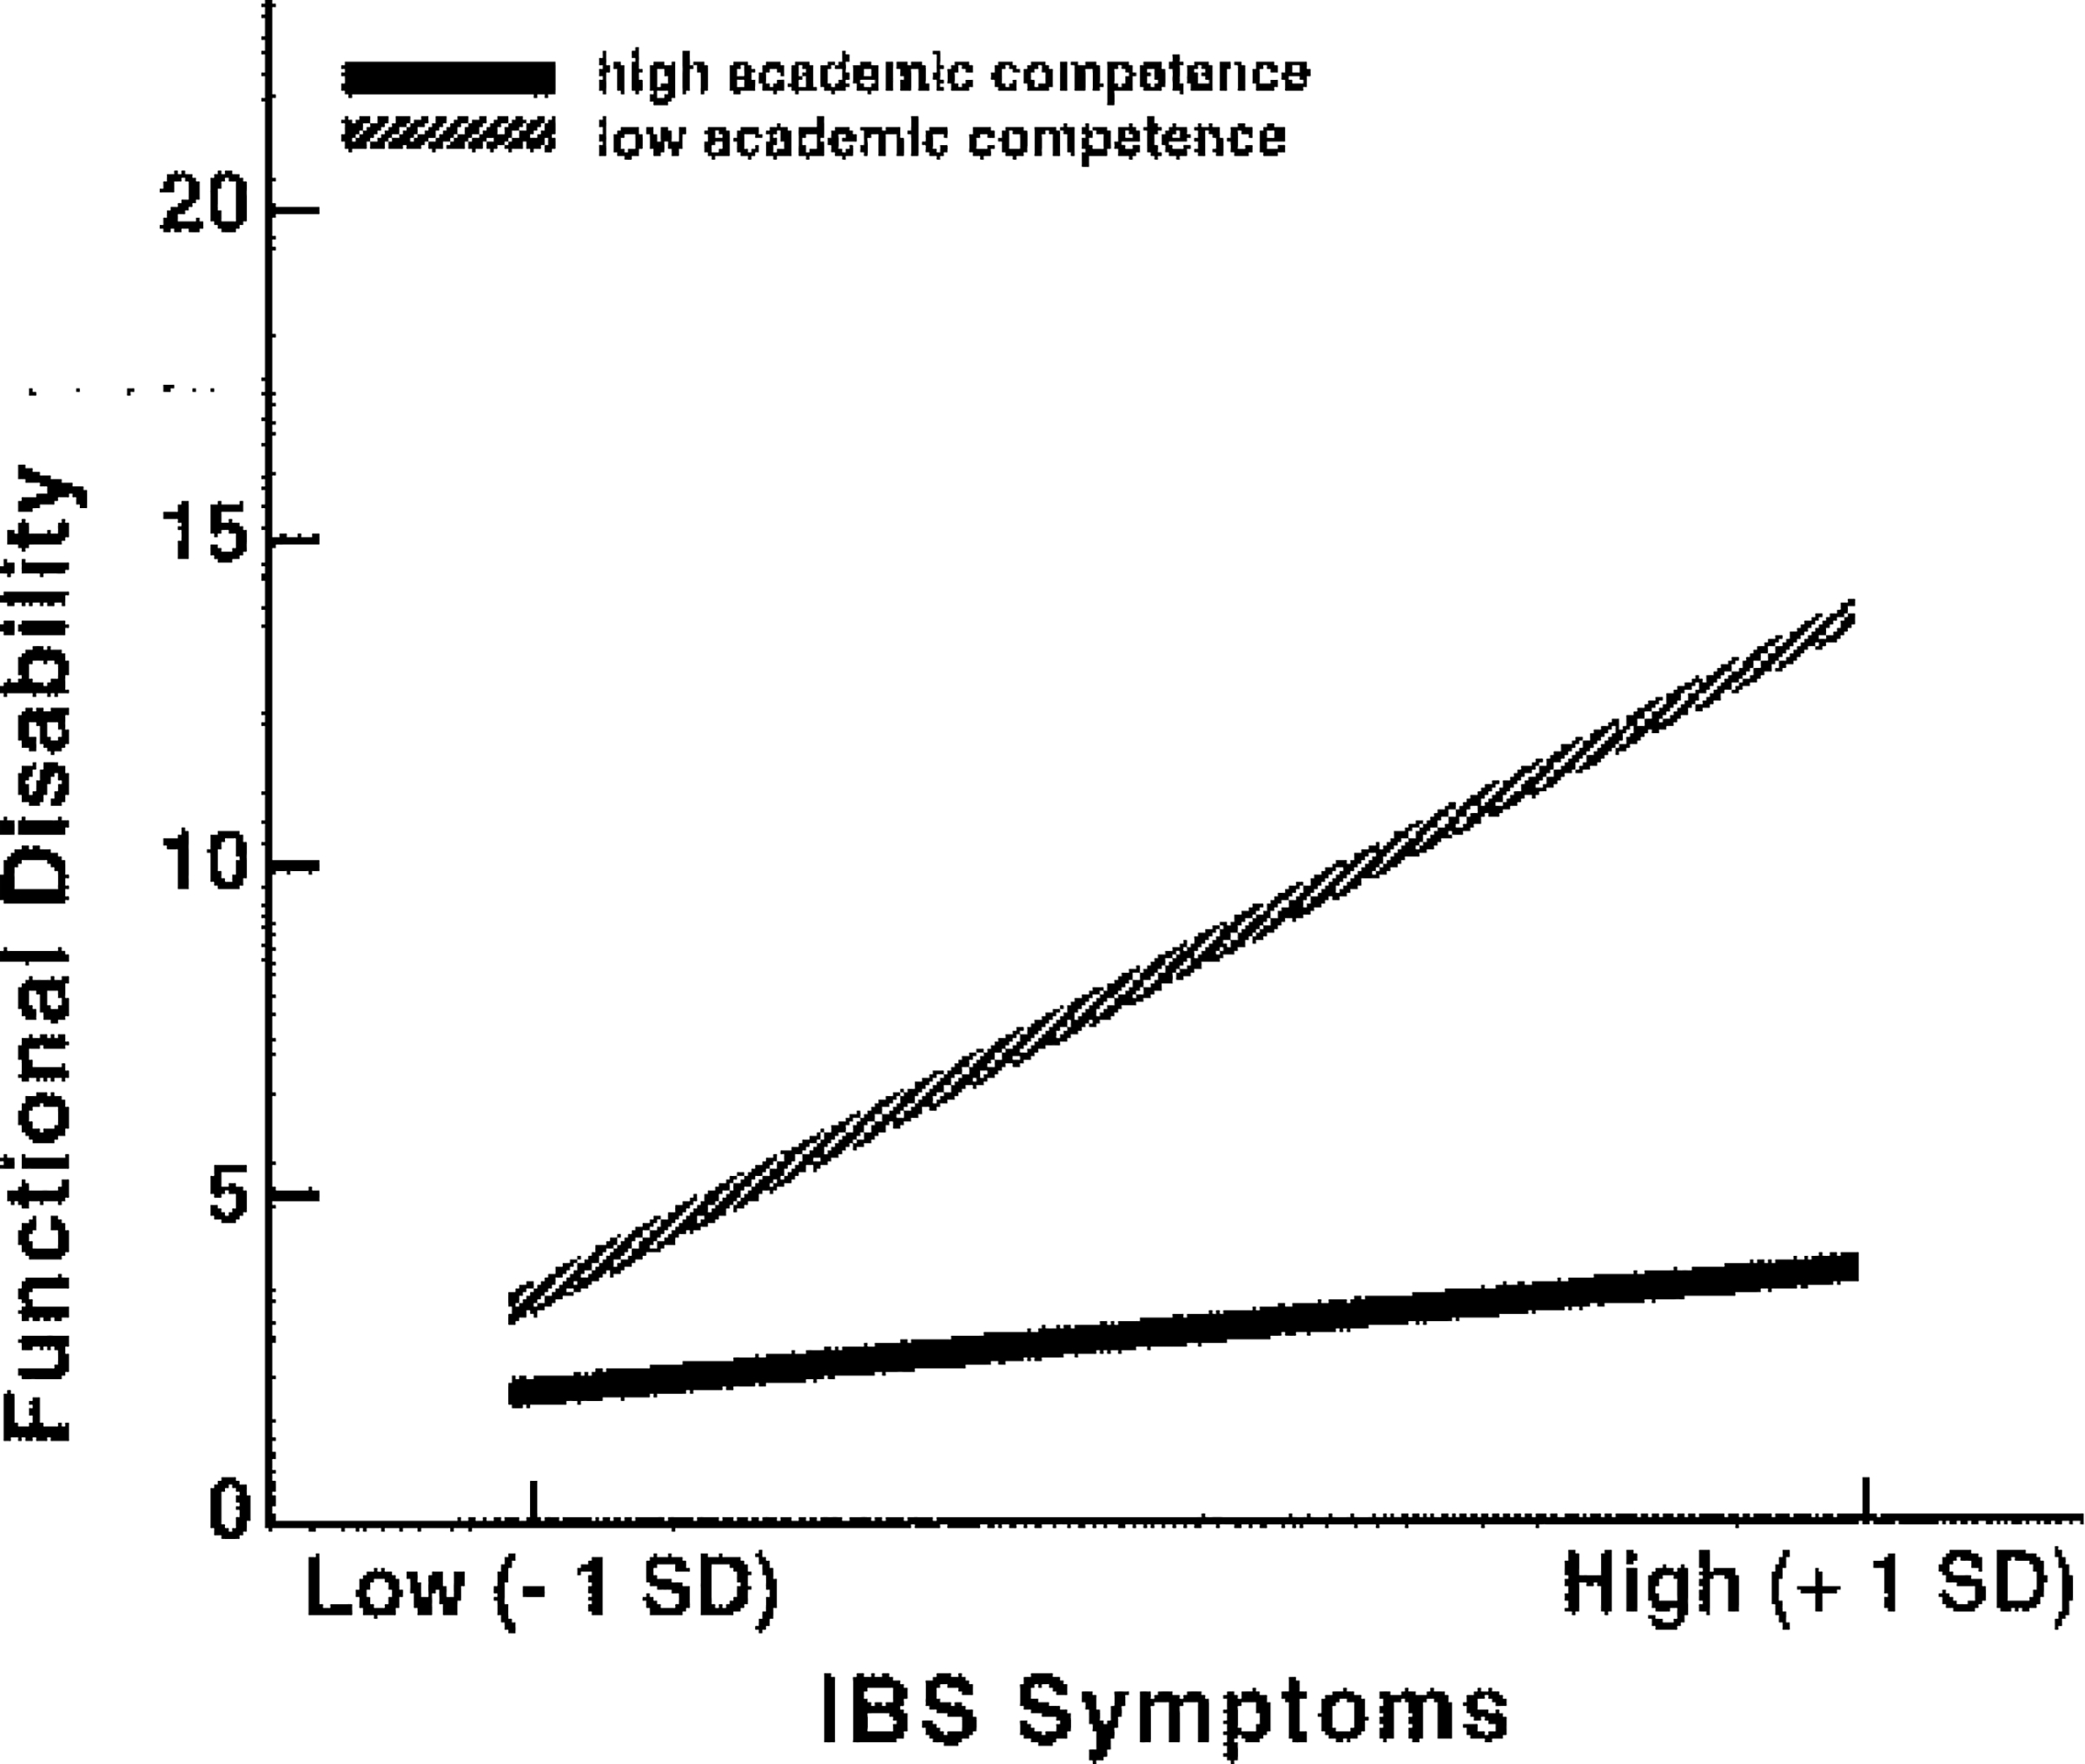
Estimated regression lines showing predicted Functional Disability Inventory (FDI) scores for subjects with low (−1 SD) and high (+1 SD) levels of academic competence on the Self-Perception Profile for Adolescents (SPPA). Graphed lines were plotted by selecting values one standard deviation above and below the mean for academic competence and IBS symptoms; these values were multiplied by their unstandardized regression coefficients to obtain values for plotting the predicted regression lines.