
Figure 2.
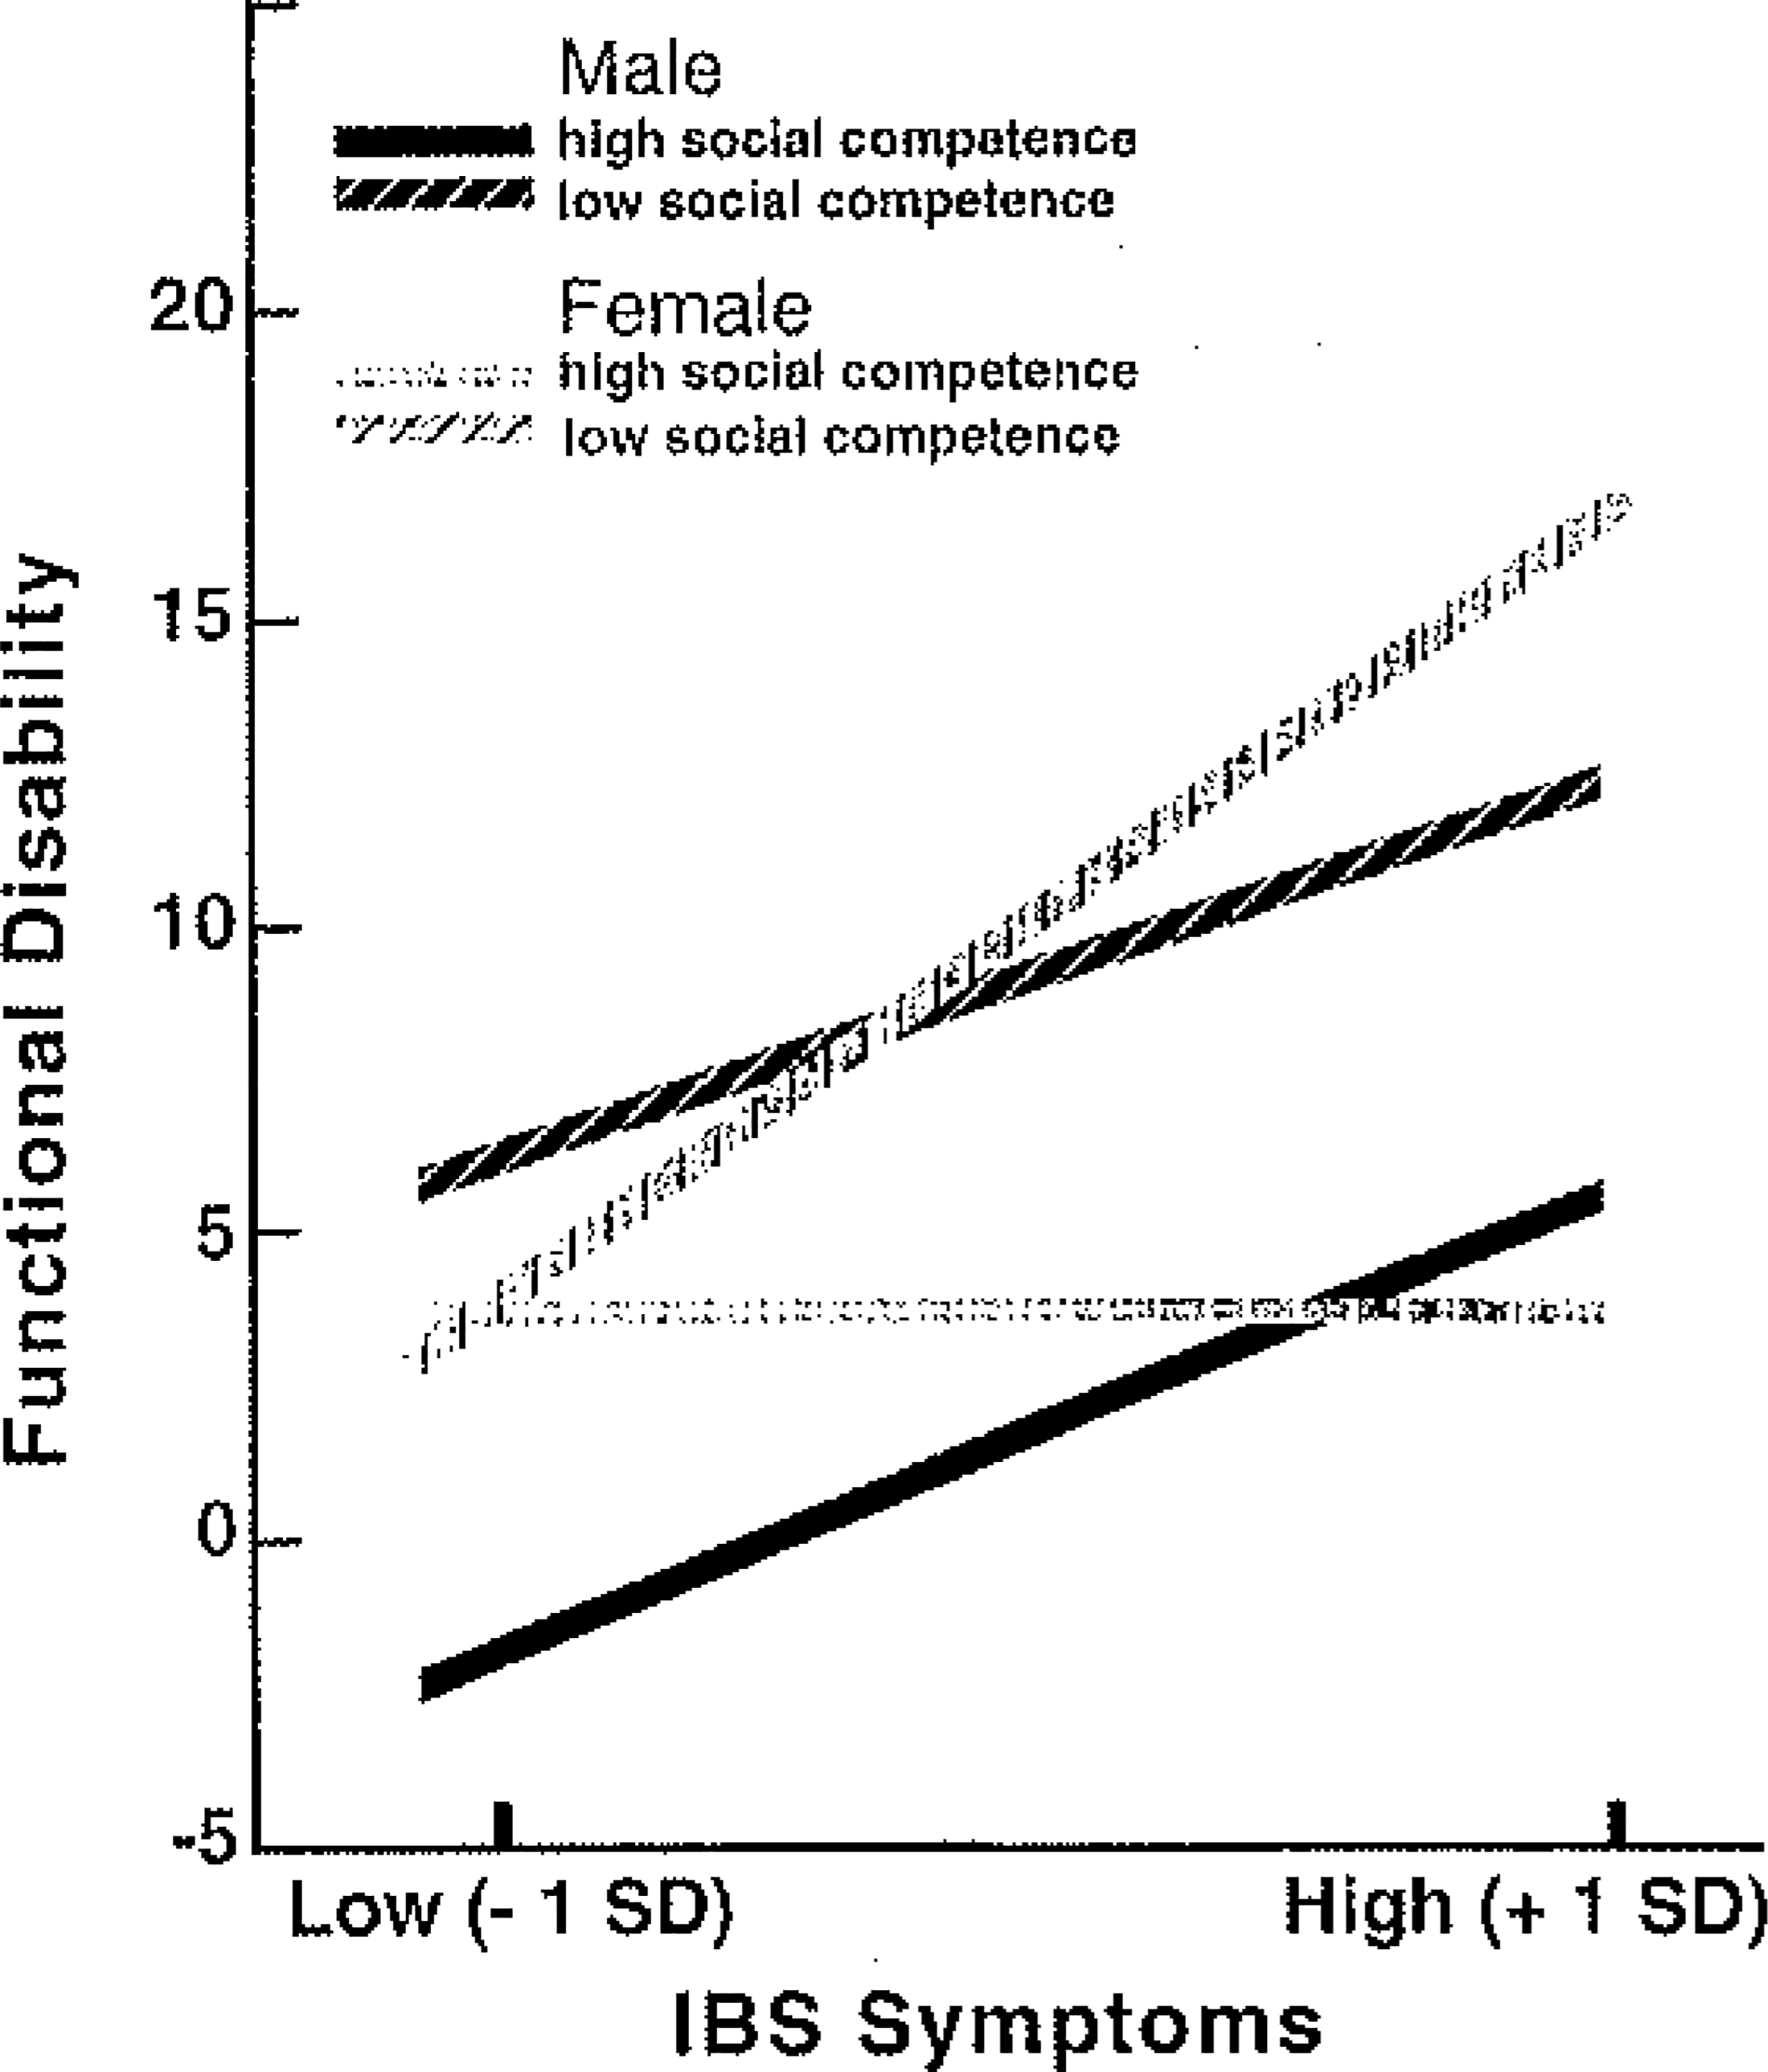
Estimated regression lines showing predicted Functional Disability Inventory (FDI) scores for subjects with low (−1 SD) and high (+1 SD) levels of social competence on the Self-Perception Profile for Adolescents (SPPA). For males and females separately, graphed lines were plotted by selecting values one standard deviation above and below die mean for social competence and IBS symptoms; these values were multiplied by their unstandardized regression coefficients to obtain values for plotting the predicted regression lines.