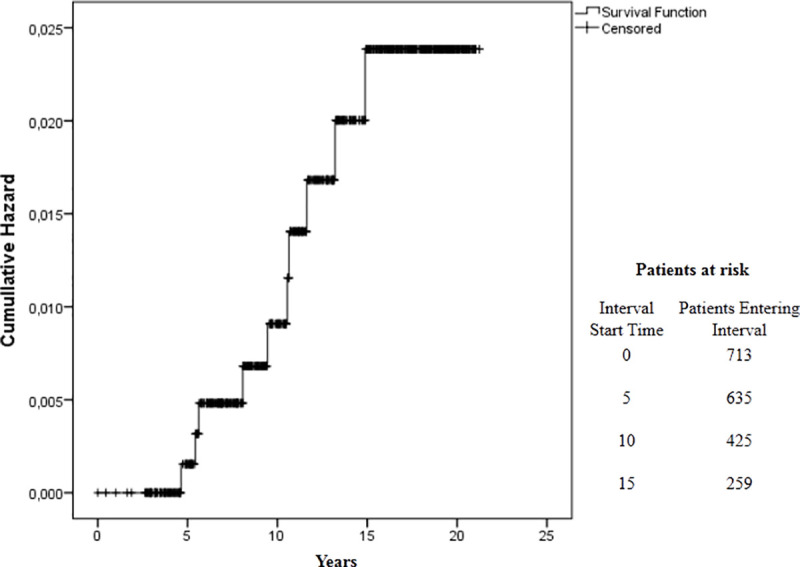
Fig 3. Kaplan-Meier Cumulative Risk of relapse in 713 patients treated with 12-dose MB-MDT.

The survival curve shows the proportion of people affected by Hansen disease without relapse according to the period of follow-up. Y-axis of the curve is the cumulative probability of relapse. The X-axis represents the survival duration. The length of the horizontal lines is the interval terminated by the occurrence of relapse events and the heights between horizontal lines illustrate the change in the cumulative probability.
