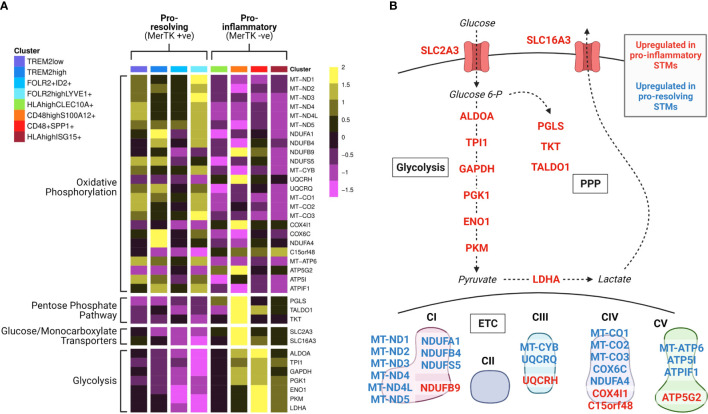
Figure 2.
Synovial tissue macrophage subpopulations display distinct metabolic gene expression signatures. Data from Alivernini et al. (39). (A) Heatmap of synovial tissue macrophage single cell RNA sequencing data displaying differential expression of metabolism-associated genes across macrophage subpopulations (clusters). Detailed information on the characterisation and function of different clusters and their contribution to different disease outcome groups can be found in Alivernini et al. (39). (B) Pathway schematic of the data from (A). Genes upregulated in at least one cluster of pro-inflammatory macrophages are displayed in red, and genes upregulated in at least one cluster of pro-resolving macrophages are displayed in blue. STM, synovial tissue macrophage; PPP, pentose phosphate pathway; ETC, electron transport chain.

