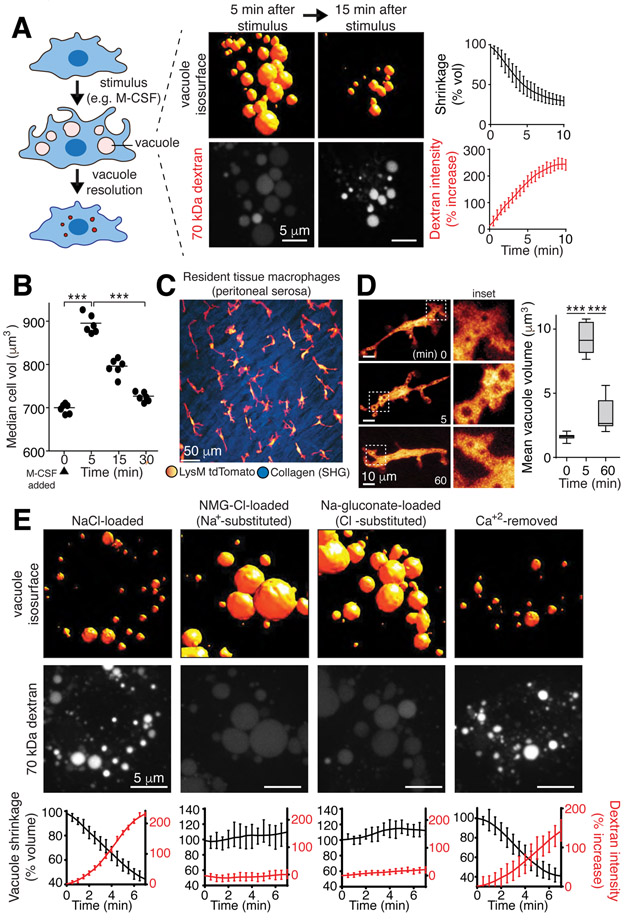
Figure 1. Vacuolar shrinkage requires monovalent ion efflux.
A, Volume and 70 kDa rhodamine-dextran fluorescence intensity changes of macropinosomes induced in bone marrow derived macrophages (BMDM) by macrophage colony-stimulating factor (M-CSF); data are means ± SEM of >100 vacuoles from 3 independent experiments (i.e. n=3). Measurement of vacuole resolution was initiated after a 5-min stimulation with M-CSF in medium containing dextran, followed by an immediate wash. B, Cell (BMDM) volume was measured electronically before and at the indicated times after M-CSF stimulation; >104 cells per point, n=3. p values determined by unpaired, two-sided t-tests. Here and elsewhere *** indicates p<0.001, ** is p<0.01 and * is p<0.05. C, Intravital observation of td-Tomato-labeled resident tissue macrophages (RTM; pseudocolored yellow/red) of the peritoneal serosa and second harmonic imaging (SHG) of collagen (blue). See also Videos S1 and S2. D, Visualization and volume quantification of M-CSF-induced macropinosomes in RTM in vivo; means, upper and lower quartiles (boxes), and distribution (whiskers) are graphed. >50 vacuoles, n=3. p values determined by Mann-Whitney U test. E, Macropinosomes of M-CSF-stimulated BMDM in media containing indicated solutes and dextran. Representative images acquired at 5 min. See also Video S3. Bottom row: mean ± SEM macropinosomal volume and dextran intensity from 3 independent video recordings representing >150 macropinosomes. See also Fig. S1.

