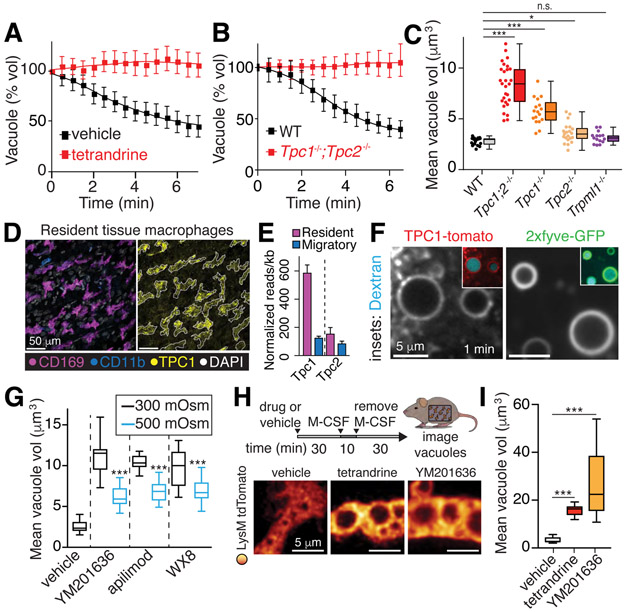
Figure 2. Monovalent ion efflux mechanisms.
A, Macropinosome volume changes in presence of 5 μM tetrandrine, measured in BMDM. Measurement of vacuole resolution was initiated once cells were washed after a 5-min stimulation with M-CSF in medium containing dextran; tetrandrine or vehicle were present throughout. Means ± SEM, n=3. See also Fig. S2 and Video S4. B-C, Macropinosome volume changes following stimulation with M-CSF in wt, Tpc1/Tpc2 single and double KO, and Trpml1 KO BMDM. In C, means, upper and lower quartiles (boxes), distribution (whiskers), and observations from fields each containing 3-5 cells (dots) measured 10 min after macropinosome formation; n=3. D, Staining of the peritoneal serosa. Outline of CD169 signal (left) overlaid on TPC1 signal (right). E, RNA-seq. Resident tissue macrophages were Cx3cr1−/Ccr2−. Migratory cells were Cx3cr1−/Ccr2+. F, BMDM expressing TPC1-tomato or 2xfyve-GFP to detect PtdIns(3)P. Dextran shown in cyan. G, BMDM stimulated with M-CSF in the presence and 70 kDa rhodamine-dextran and, where indicated, the PIKfyve inhibitors YM201636, apilimod, or WX8 (all used at 500 nM). Resolution was recorded as in A. 5 min after iso-osmotic recording, a hyperosmotic solution (final 500 mOsm) was added to verify the osmotic responsiveness of the vacuoles. H-I, Visualization and volume quantification of macropinosomes in RTM treated in situ with YM201636 (500 nM) or tetrandrine (5 μM); >15 cells, n=3. All p values determined by Mann-Whitney U tests.

