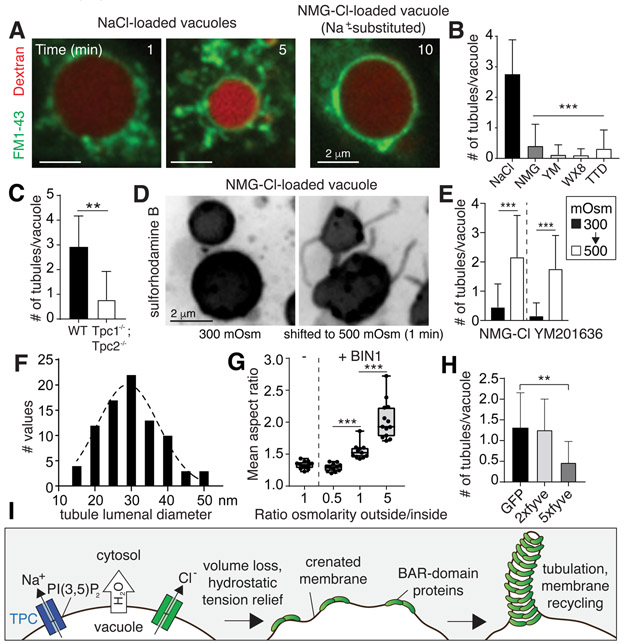
Figure 3. Osmotically-driven shrinkage induces tubulation.
A, BMDM were stimulated with M-CSF and the distribution of 70 kDa rhodamine-dextran and FM1-43 imaged at the indicated times after removal of the stimulus. B-C, Mean number of tubules (exceeding 1 μm in length) measured 5 min after stimulation with M-CSF; >100 macropinosomes (n=3) for each condition. D-E, Macropinosomes containing sulforhodamine B and N-methylglucamine chloride or formed in cells treated with YM201636 (500 nM) were recorded 10 min after formation, before and after being subjected to hypertonic solution. See also Video S5. >100 vacuoles, n=6. F, TEM was used to measure the diameter of tubules emerging from macropinosomes; 85 tubules quantified. G, Liposomes formed of whole brain lipid, rhodamine-labelled phosphatidylethanolamine, and PtdIns(4,5)P2 in 20 mOsm solution. The mean aspect ratio for 3-5 fields of liposomes incubated with or without recombinant human BIN1 was quantified by imaging, n=3. H, HT1080 cells expressing GFP, 2xfyve-GFP, or 5xfyve-GFP were pulsed with SRB for 10 min. Mean number of tubules (exceeding 1 μm in length); >100 macropinosomes (n=3) for each condition. All p values determined by unpaired, two-sided t-tests. I, Model of mechanism proposed to underlie macropinosomal tubulation.

